
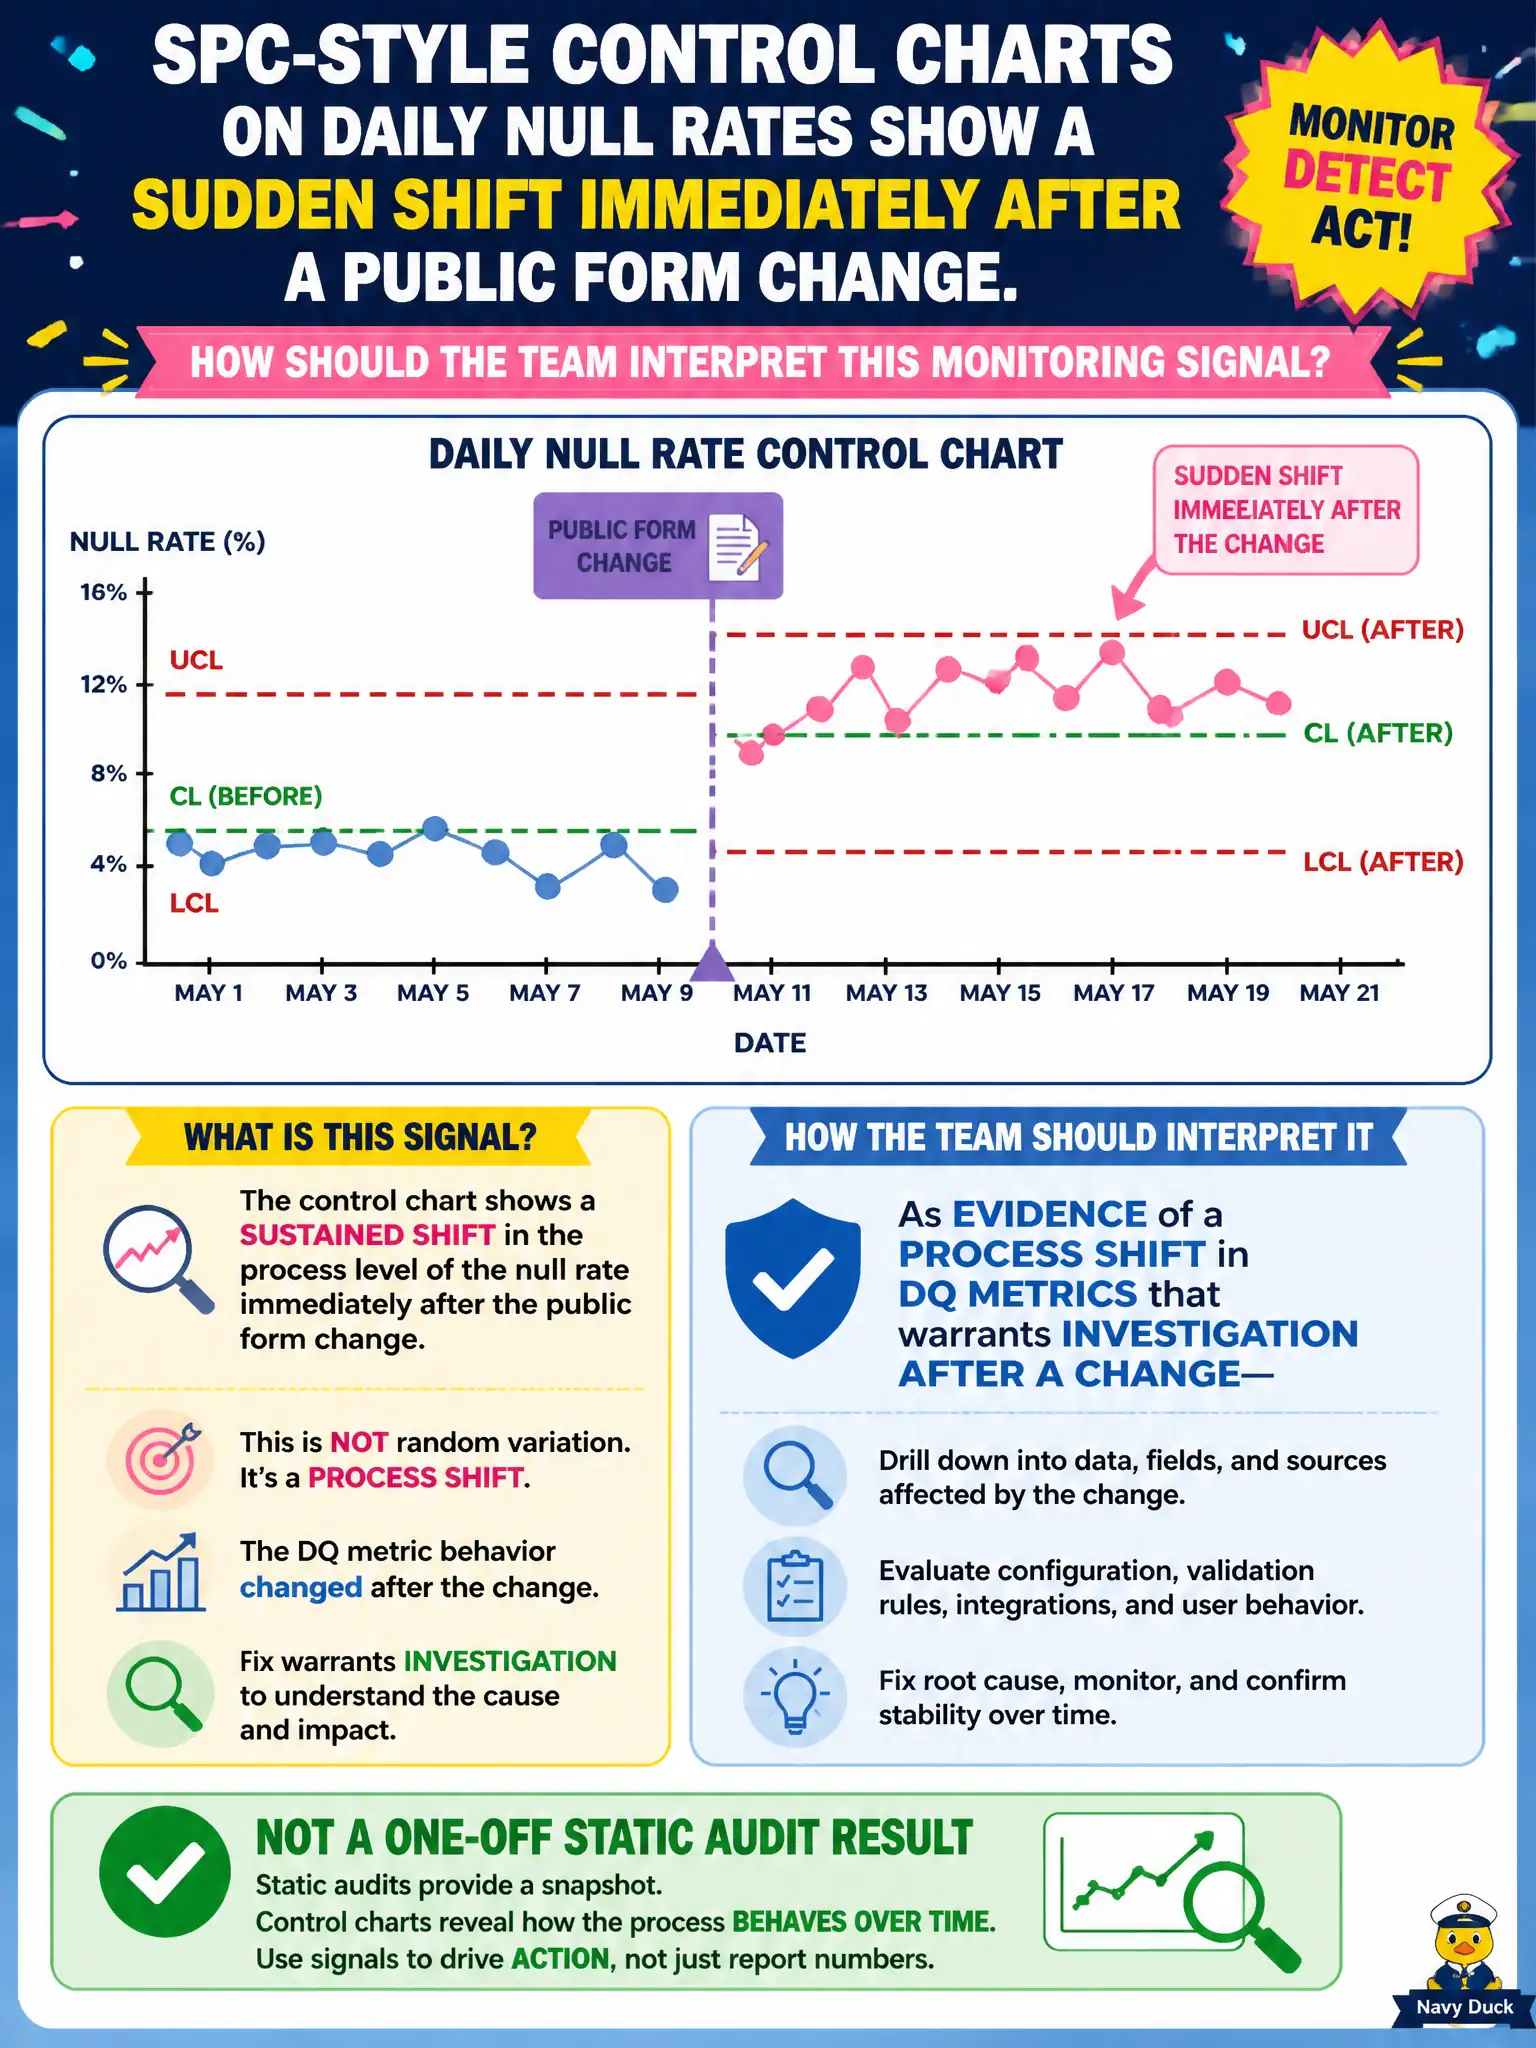
SPC-style control charts on daily null rates show a sudden shift immediately after a public form change. How should the team interpret this monitoring signal?
Select an answer to reveal the explanation.
Short Explanation
When the null-rate line jumps the day the form changed, the chart is waving a flag—something in the process moved. Diagnostic monitoring watches for shifts over time, not just a single audit snapshot. Go investigate the form change.
Full Explanation
SPC-style control charts on DQ metrics help detect process shifts over time, not only static audit snapshots. When daily null-rate charts show a sudden shift immediately after a public form change, the team should interpret the signal as evidence of a process shift that warrants investigation—not as unrelated noise or a uniqueness improvement. Assuming control charts replace the need to review form design forever overclaims monitoring and underinvests in prevention. Calling the shift a uniqueness improvement because nulls are no longer counted daily misunderstands both the chart and the uniqueness dimension. Dismissing the shift as noise that can never connect to form changes ignores a classic change-point pattern in civic systems. Exam caveat: confirm the change window and rule out coincident extract bugs before blaming the form; correlation still needs operational verification. Operational check: annotate the chart with the form release, compare null rates pre/post on the affected fields, roll back or fix validation if the change caused the spike, and keep the annotation in the DQ runbook. Municipal product owners should require a DQ impact note in every public-form change request.