
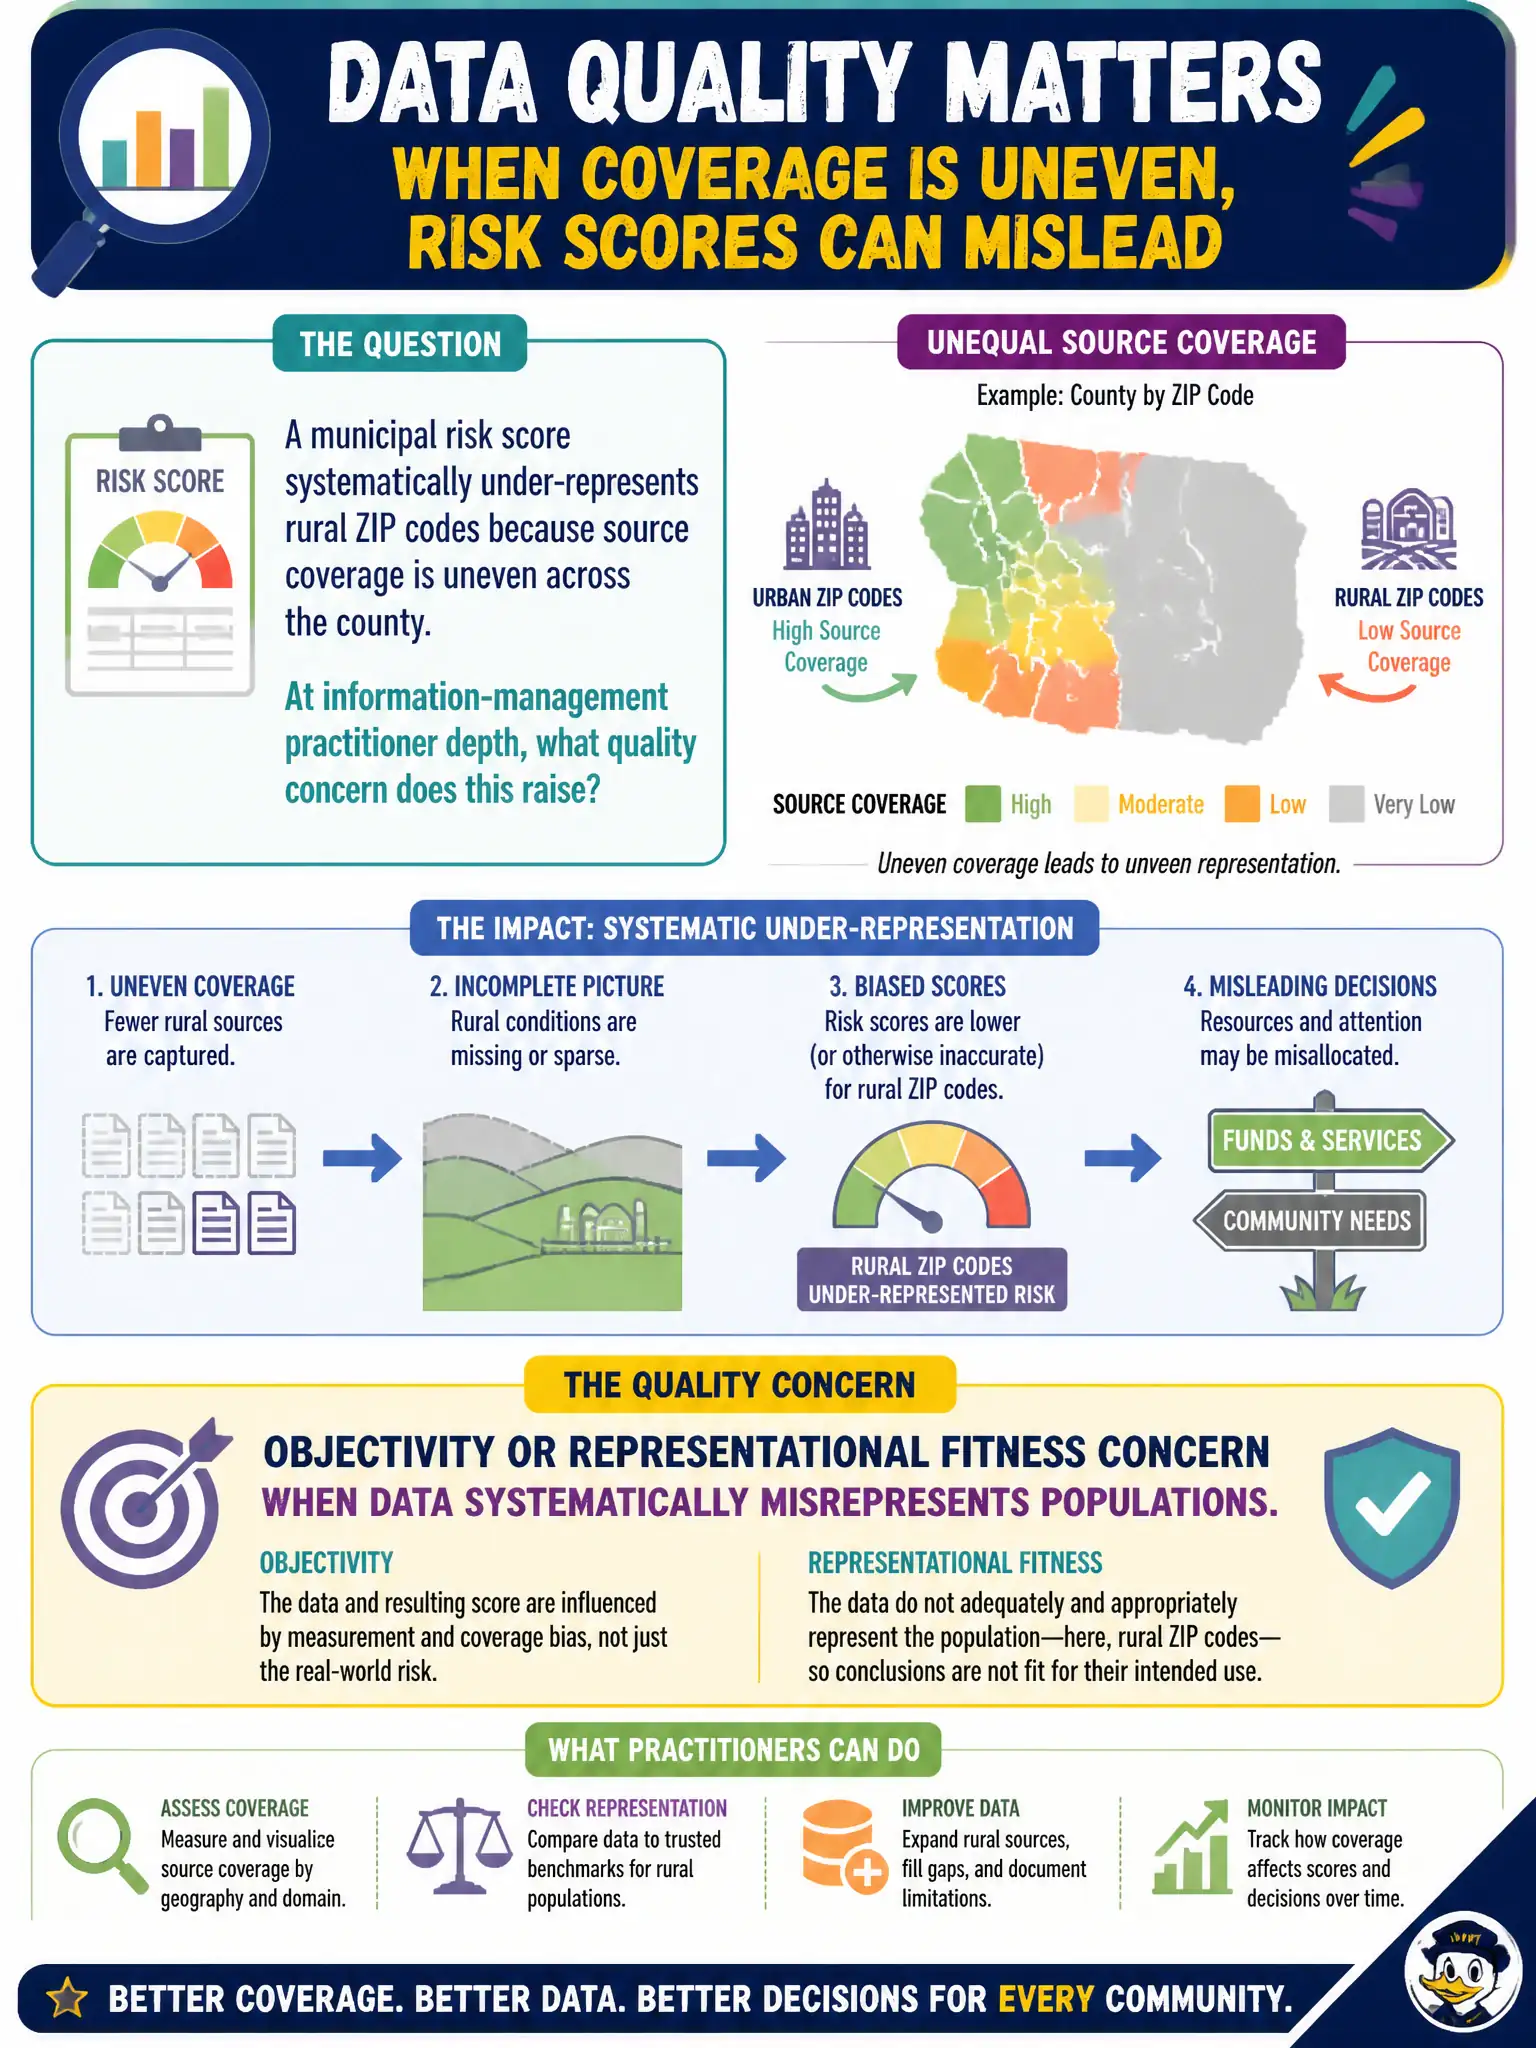
A municipal risk score systematically under-represents rural ZIP codes because source coverage is uneven across the county. At information-management practitioner depth, what quality concern does this raise?
Select an answer to reveal the explanation.
Short Explanation
If rural ZIPs barely show up in the source, the score is like a survey that only called downtown—skewed from the start. Representational fitness and objectivity concerns ask whether the data fairly reflects the population. Uneven coverage is a quality issue, not just a modeling footnote.
Full Explanation
Objectivity and representational fitness concern whether data systematically misrepresents populations or phenomena relative to the decision being made. A municipal risk score that under-represents rural ZIP codes because source coverage is uneven across the county raises that concern at practitioner depth: the product may be biased relative to countywide equity and service planning, even if individual urban rows look complete. Dismissing the issue as only a font-rendering problem in the GIS legend ignores coverage bias in the underlying sources. Deleting rural ZIPs to 'improve model accuracy' worsens representational harm and hides the coverage gap. Duplicating urban ZIP rows to chase uniqueness does not fix under-representation of rural areas and can distort rates further. Exam caveat: representational fitness is judged against the stated civic purpose; a city-core operations model may accept different coverage than a countywide equity analysis. Operational check: compare ZIP coverage and score distributions to census or service-area baselines, document known gaps for leadership, and either enrich rural sources or restrict model claims to covered areas. County executives should see an explicit coverage map with the risk product so rural residents are not silently deprioritized by incomplete inputs.