
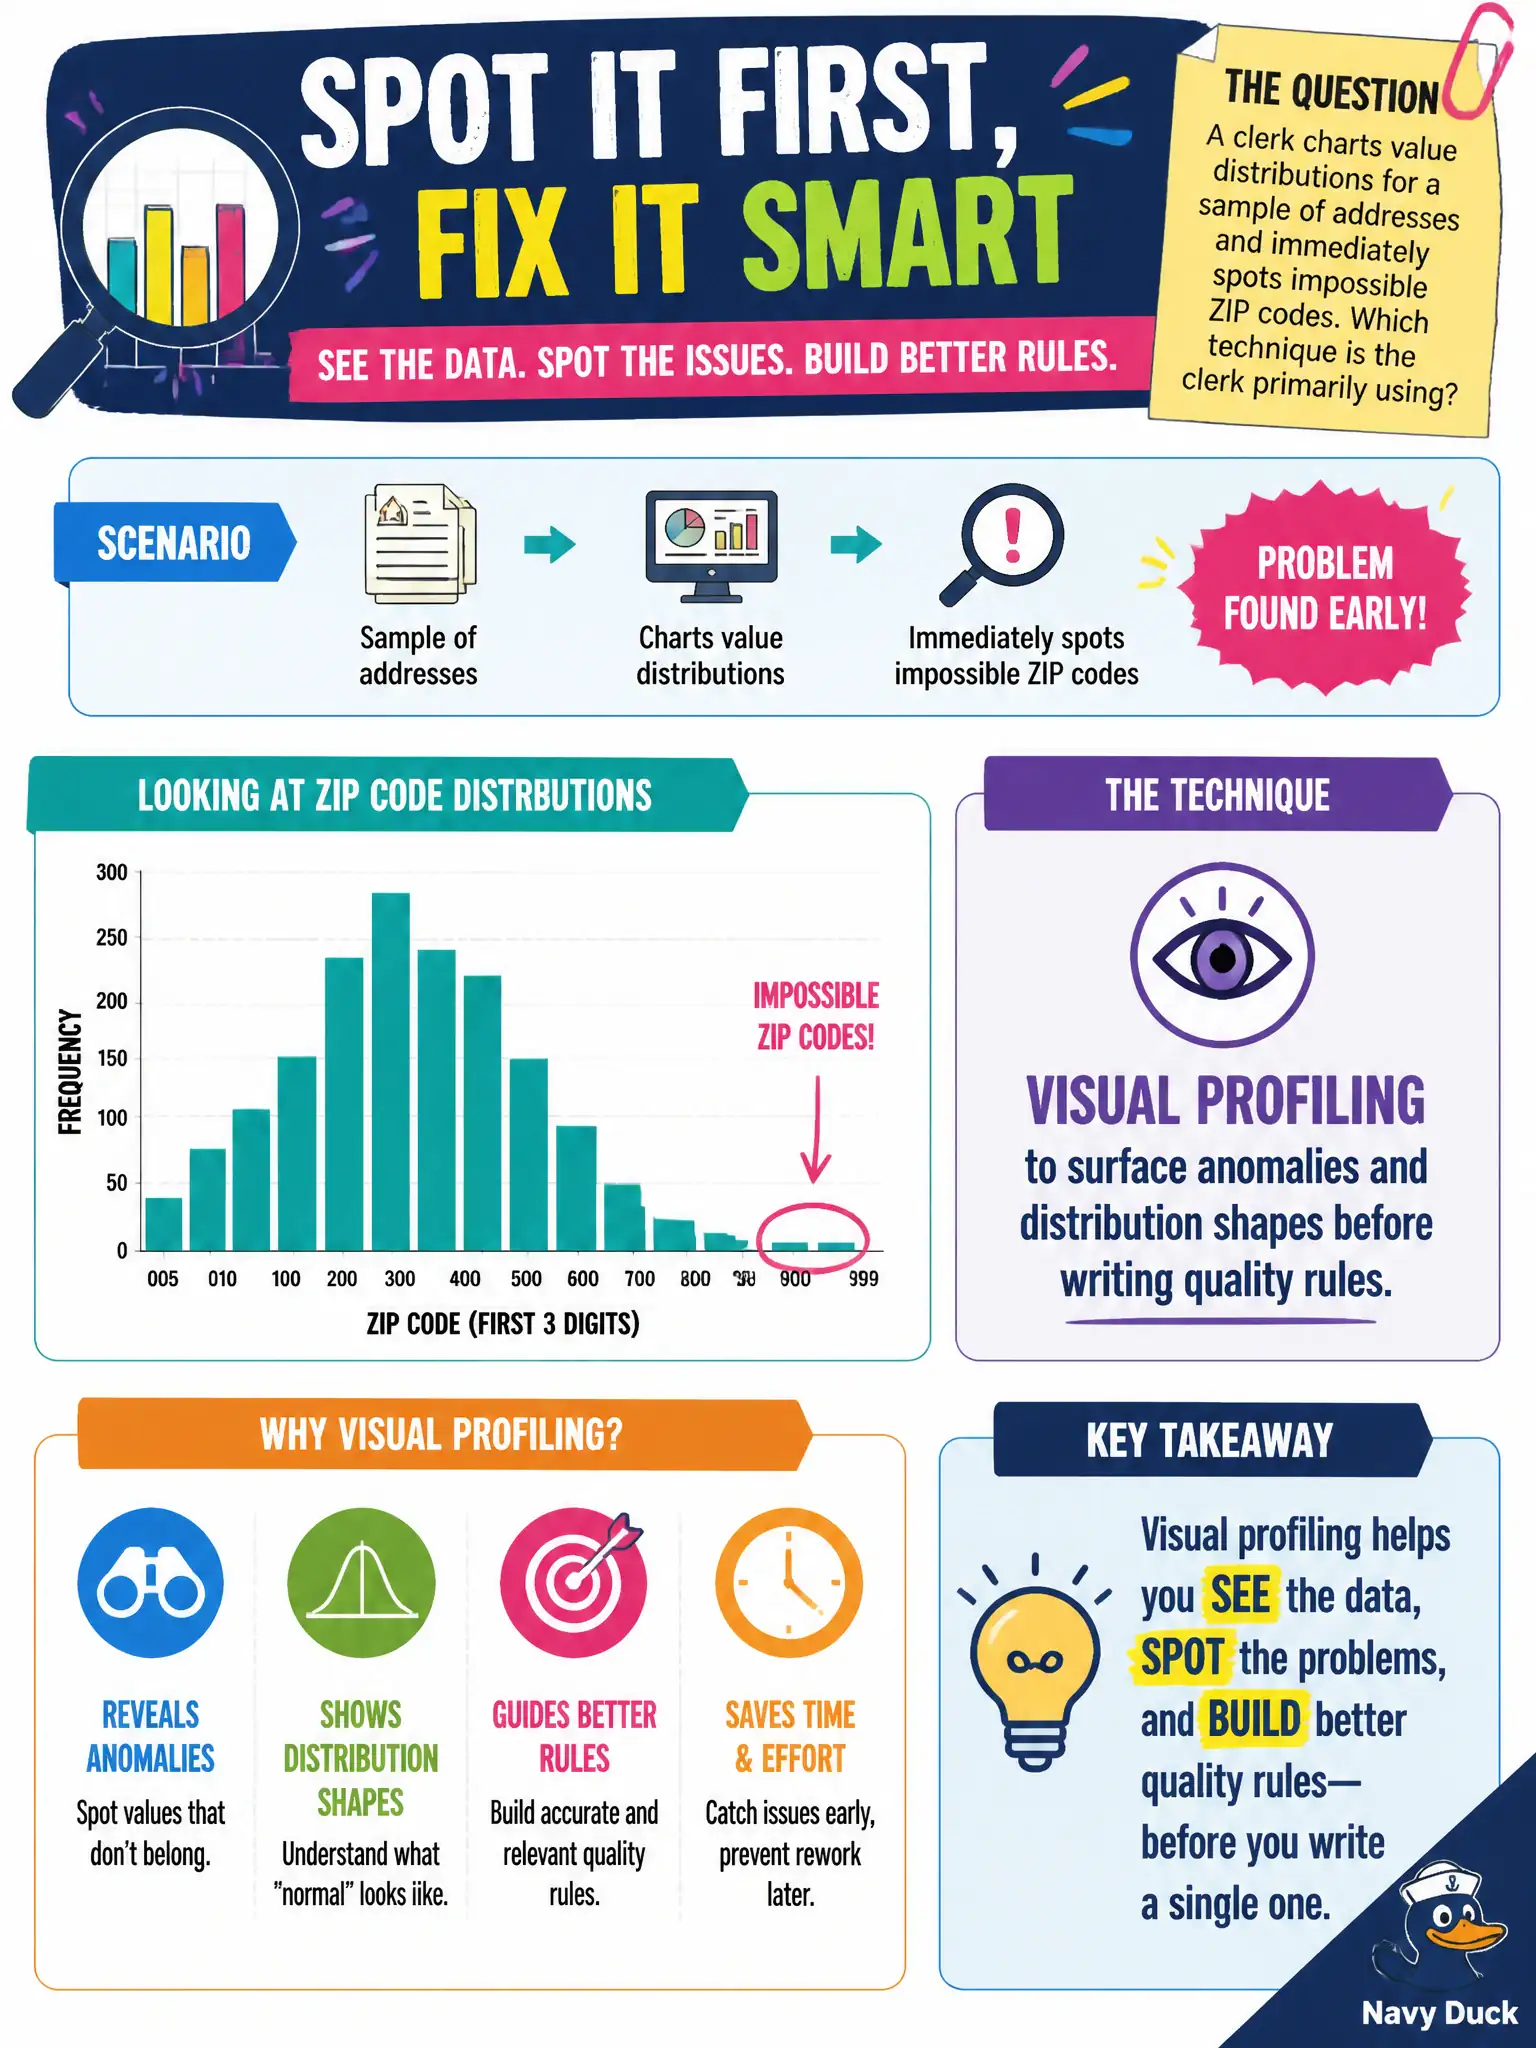
A clerk charts value distributions for a sample of addresses and immediately spots impossible ZIP codes. Which technique is the clerk primarily using?
Select an answer to reveal the explanation.
Short Explanation
A chart that screams '99999' is the eyeball version of profiling—you see the weird pile before you write a rule. Visual profiling helps anomalies jump out. It is discovery, not the final fix.
Full Explanation
Visual profiling uses charts and distribution views to surface anomalies and shapes before quality rules are finalized. A clerk who charts value distributions for a sample of addresses and immediately spots impossible ZIP codes is primarily using visual profiling, not master-data survivorship or encryption. Master data survivorship that overwrites every ZIP with the mode of the chart jumps to remediation and can encode the wrong survivor without business rules. Encryption key rotation does not make impossible ZIPs disappear as a quality technique; it addresses key management, not value validity. Closing issue tickets without inspecting underlying values skips the discovery the chart provided. Exam caveat: visual profiling is a discovery aid; impossible ZIPs still need rule definition, steward review, and source prevention after they are spotted. Operational check: capture the chart screenshot in the DQ issue, confirm the ZIP against the postal authority list, quantify how many rows fail, and propose a format or reference rule before mass update. Civic addressing teams should keep a standard visual-profile checklist for new extracts so impossible geographies are caught before public maps publish.