
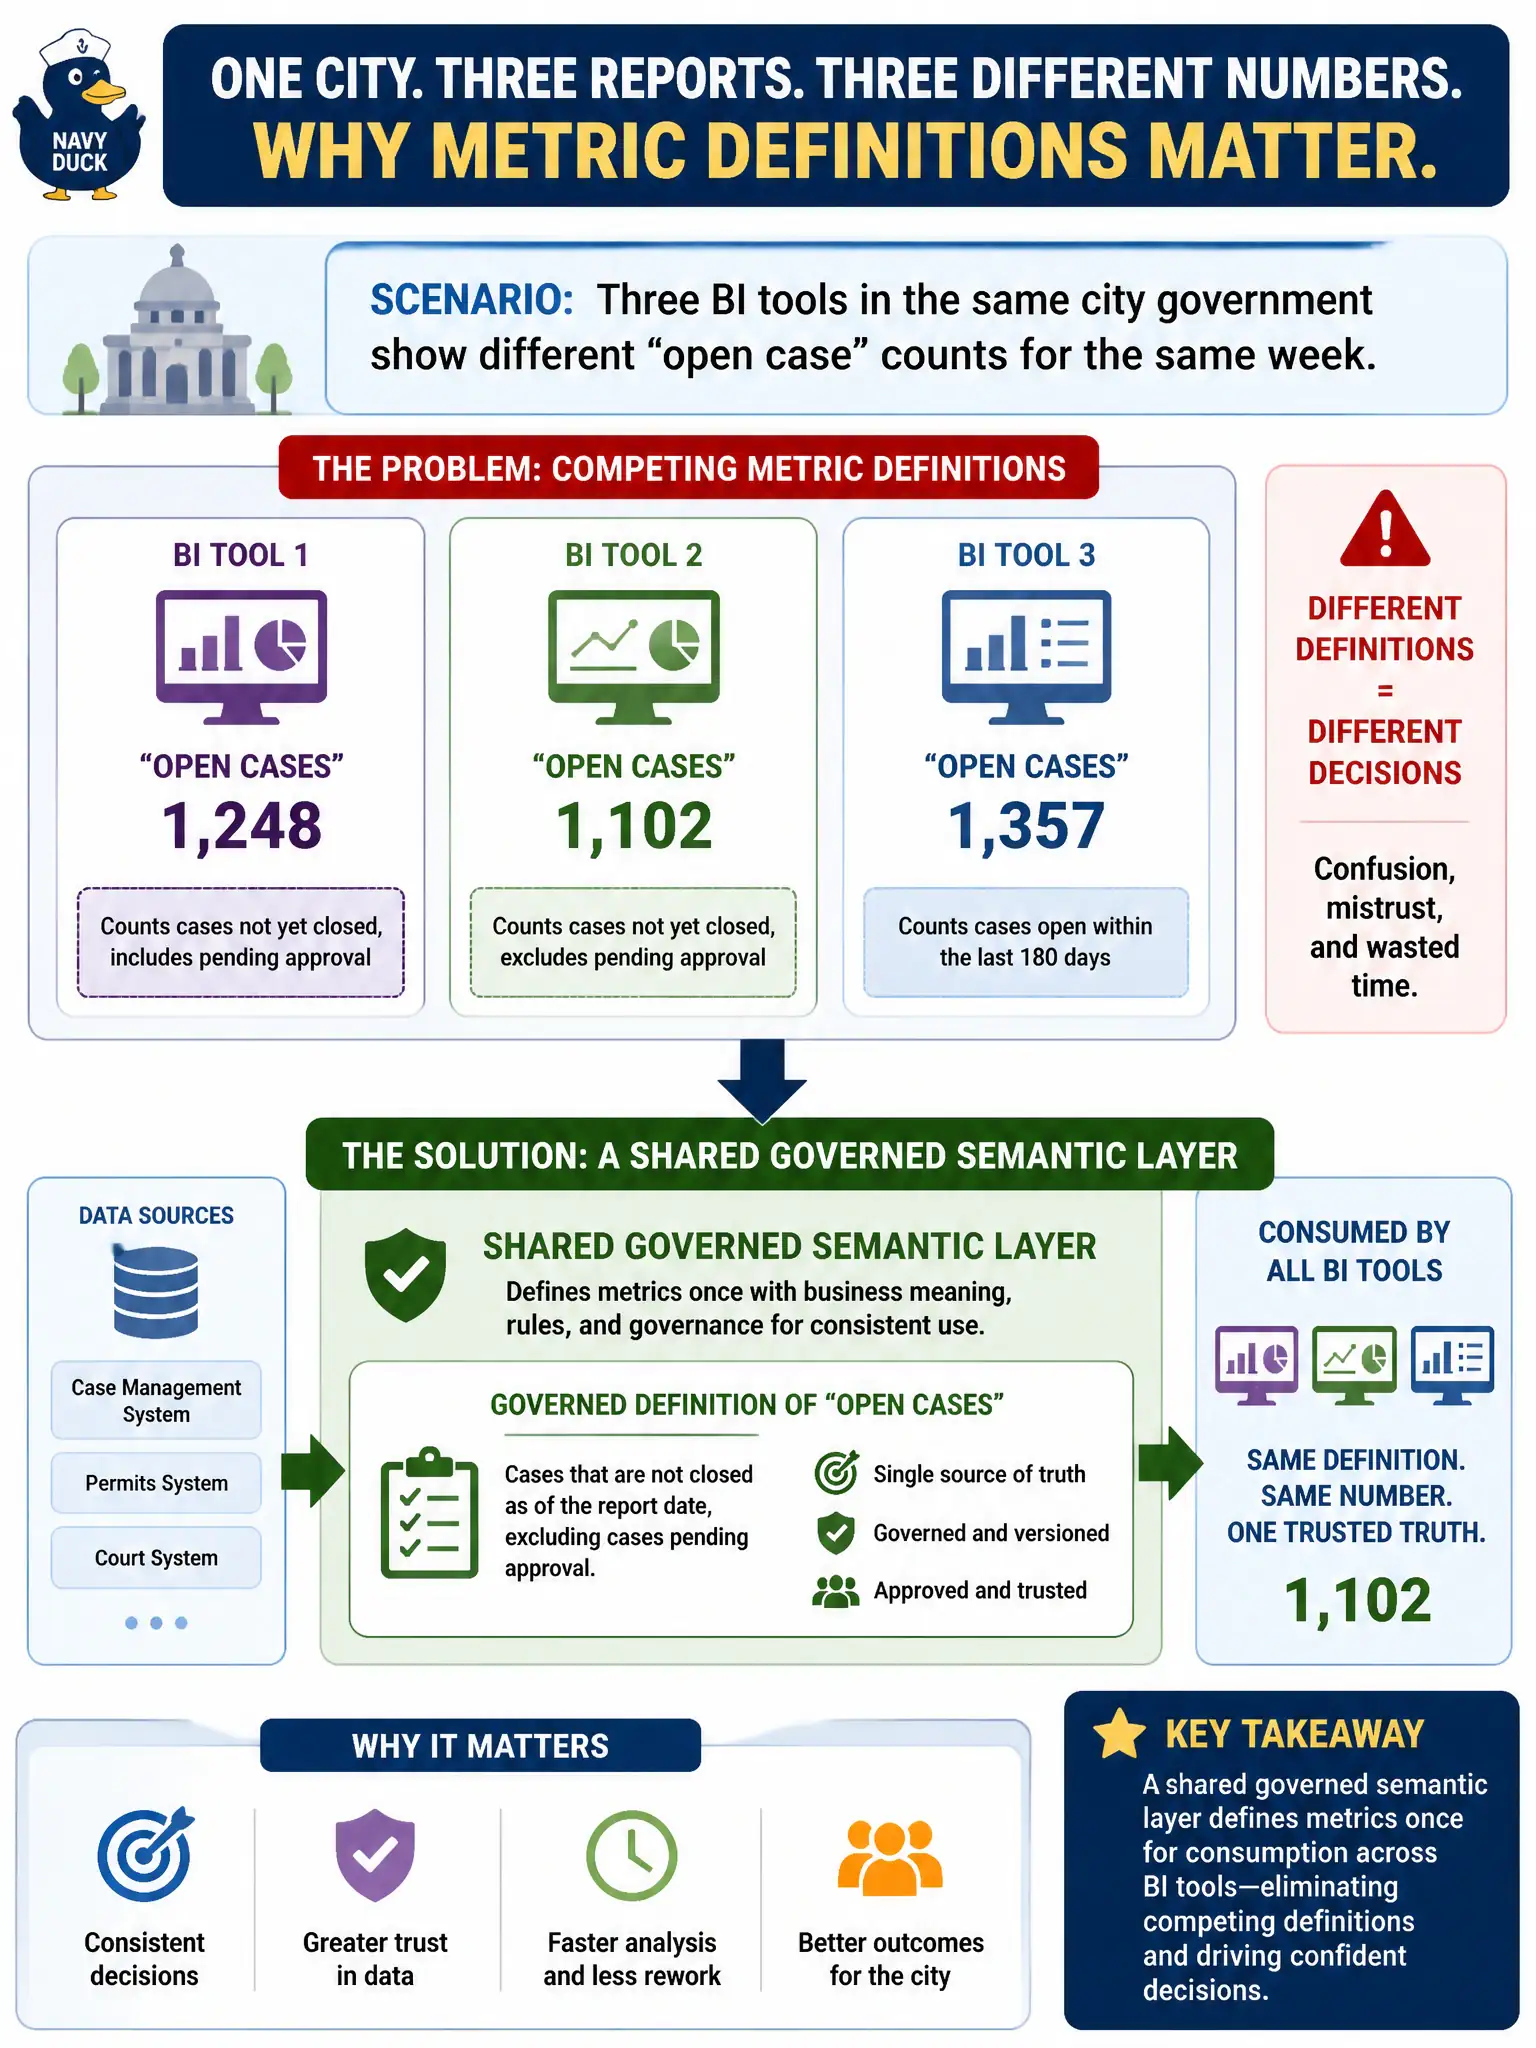
Three BI tools in the same city government show different “open case” counts for the same week. What architectural layer most directly mitigates competing metric definitions?
Select an answer to reveal the explanation.
Short Explanation
Three scoreboards, three different scores—citizens notice. A shared semantic layer is the one playbook so every BI tool counts “open case” the same way.
Full Explanation
When three BI tools in the same city government show different “open case” counts for the same week, the root architectural gap is usually competing metric definitions rather than chart cosmetics. A shared governed semantic layer defines metrics, joins, and KPI logic once for consumption across tools, placing semantics under stewardship instead of embedding divergent formulas in every report. That layer bridges data platforms and analysis so leaders see consistent certified numbers. Adding more dashboard colors so conflicting numbers look intentional aestheticizes disagreement instead of resolving it. Keeping separate secret metric formulas locked inside each tool with no reconciliation institutionalizes distrust. Banning metrics so leaders decide from anecdotes only abandons evidence-based civic management. Exam caveat: a semantic layer must be governed—ownership, change control, and certification labels matter; simply installing another BI feature without stewardship will recreate forks. Operational check: publish a single “open case” definition with owner and calculation rules in the semantic layer; point all three tools at that definition; reconcile historical discrepancies; and monitor for unauthorized local overrides that reintroduce forks.