
Permit backlog looks stubborn when measured only as today's queue length. What alternate view better explains process health over time?
Select an answer to reveal the explanation.
Short Explanation
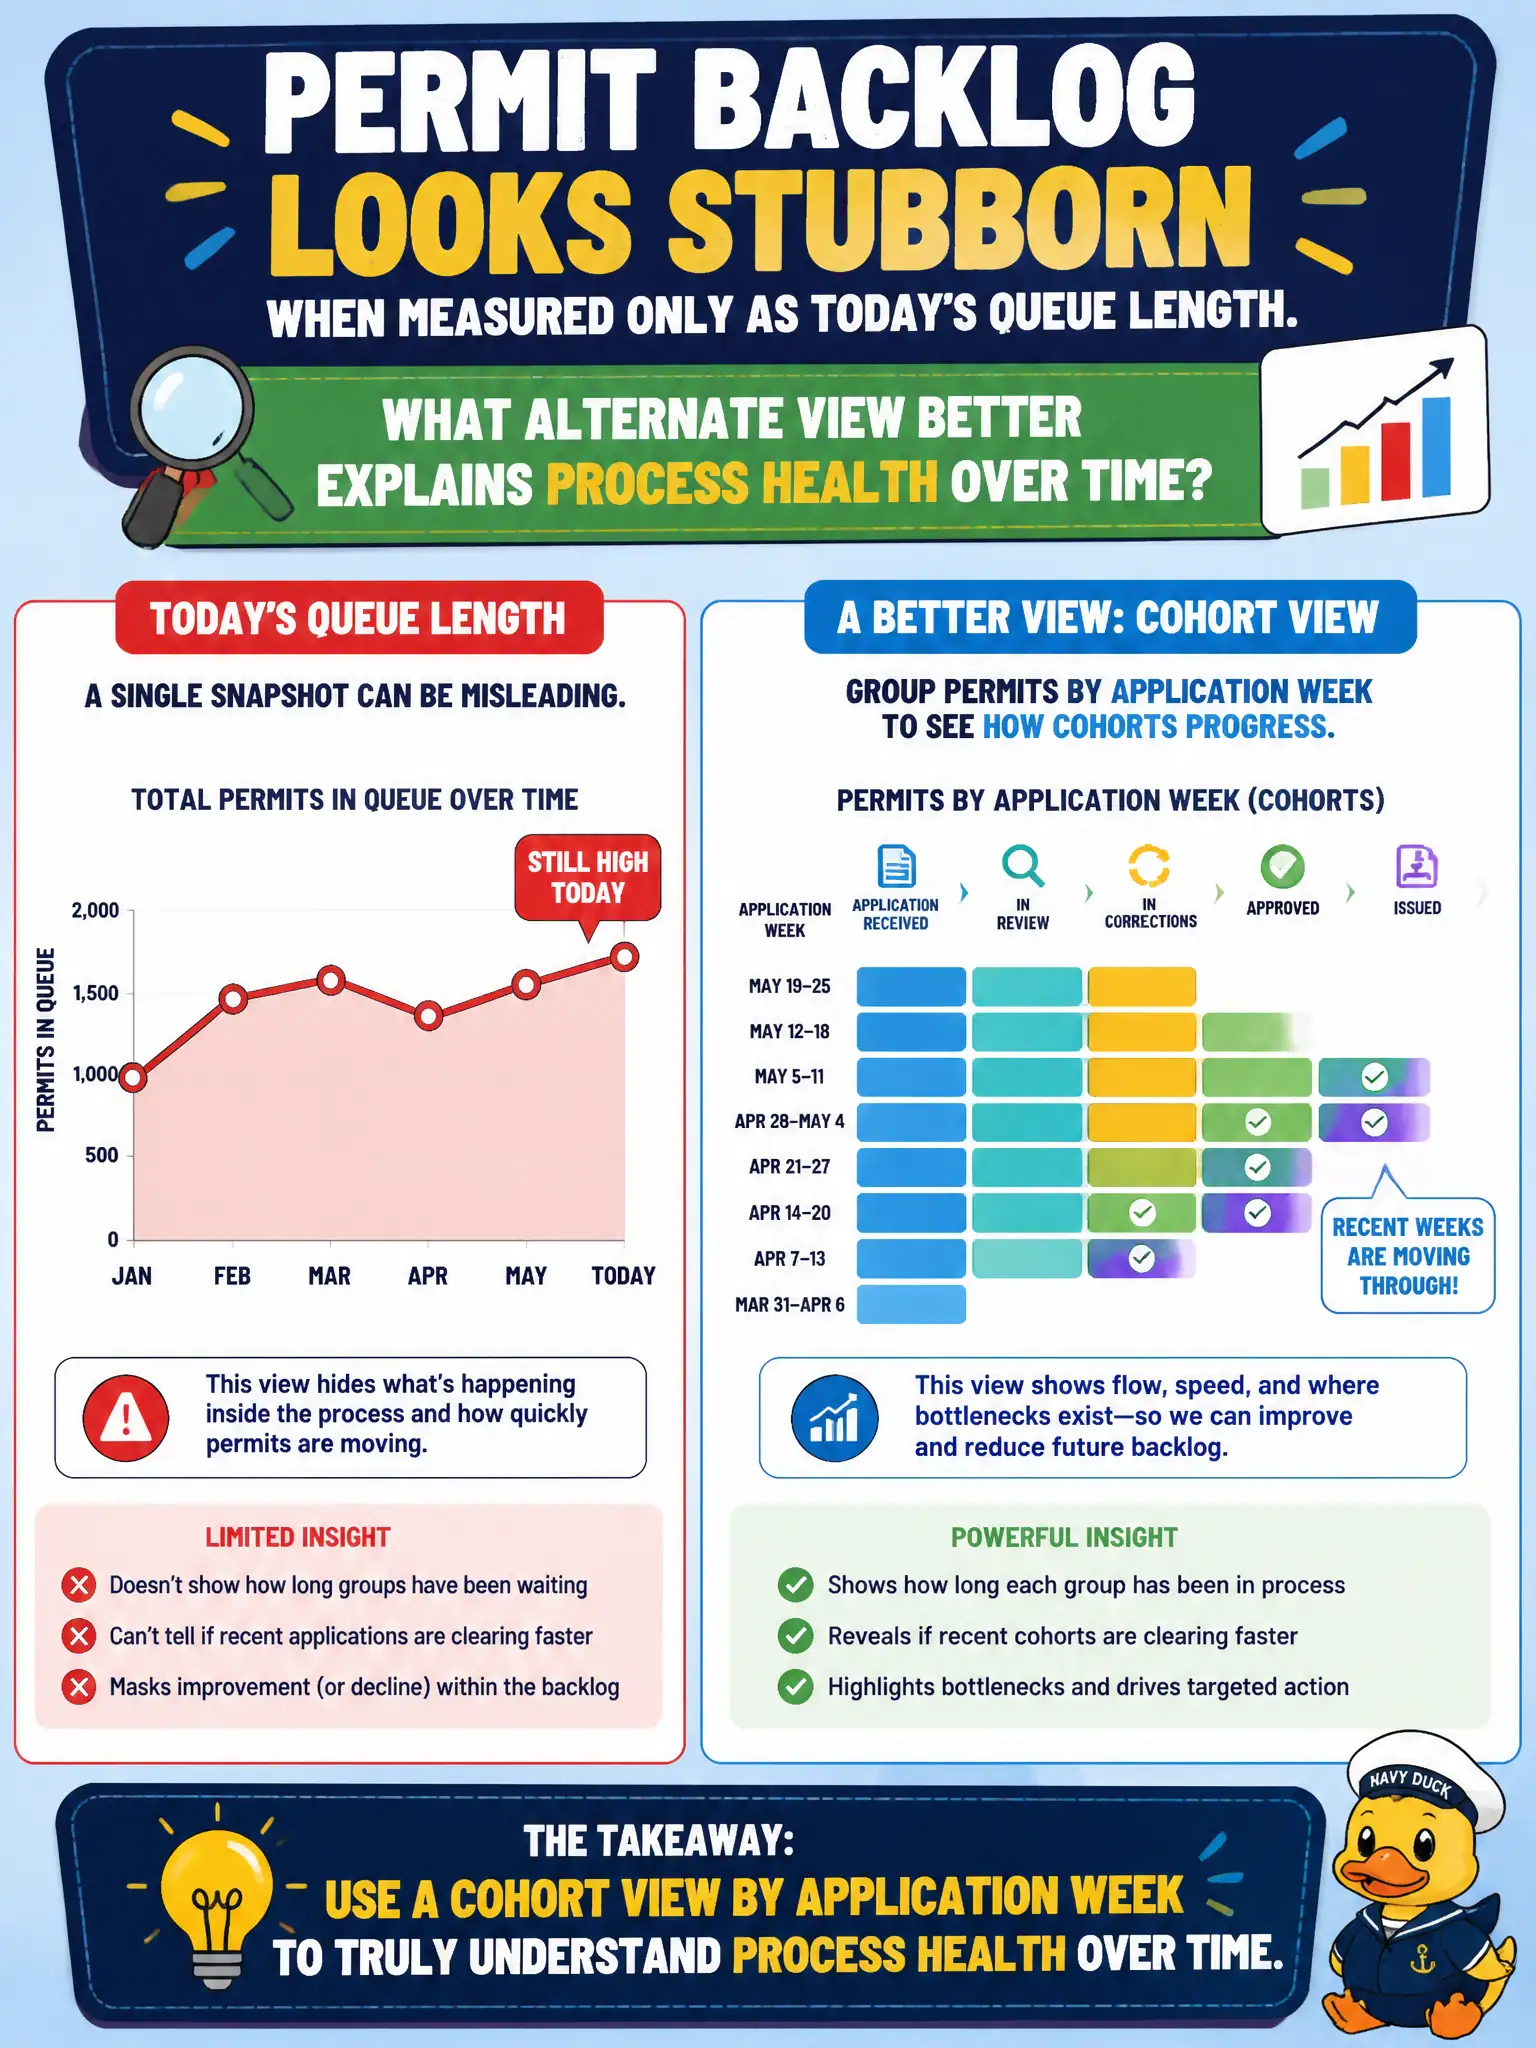
Today's queue length is a still photo; cohorts are the time-lapse. Watching permits by application week shows whether groups clear or stall. That story beats one lonely backlog number.
Full Explanation
Permit backlog that looks stubborn when measured only as today’s queue length is better explained with a cohort view of permits by application week to see how groups progress through the process. Cohorts reveal whether clearance is slowing, stalling at a stage, or simply accumulating new intake—insights a single point-in-time queue length conceals for municipal permitting operations. A single all-time maximum queue length with no time dimension fails by providing a static scare number without process dynamics. A vanity count of webpage visits to the permit portal fails by measuring attention rather than permit flow health. A one-day snapshot of clerk headcount without permit outcomes fails by reporting inputs without linking them to clearance. Exam caveat: queue length remains useful as an operational nowcast for staffing, but diagnosing chronic backlog and process health usually needs cohorts or flow metrics, not snapshots alone. Operational check: build weekly application cohorts with stage timestamps, chart progression and aging, compare cohorts before and after process changes, keep a separate live queue view for supervisors, and brief directors with cohort-based process health rather than only today’s queue length.