
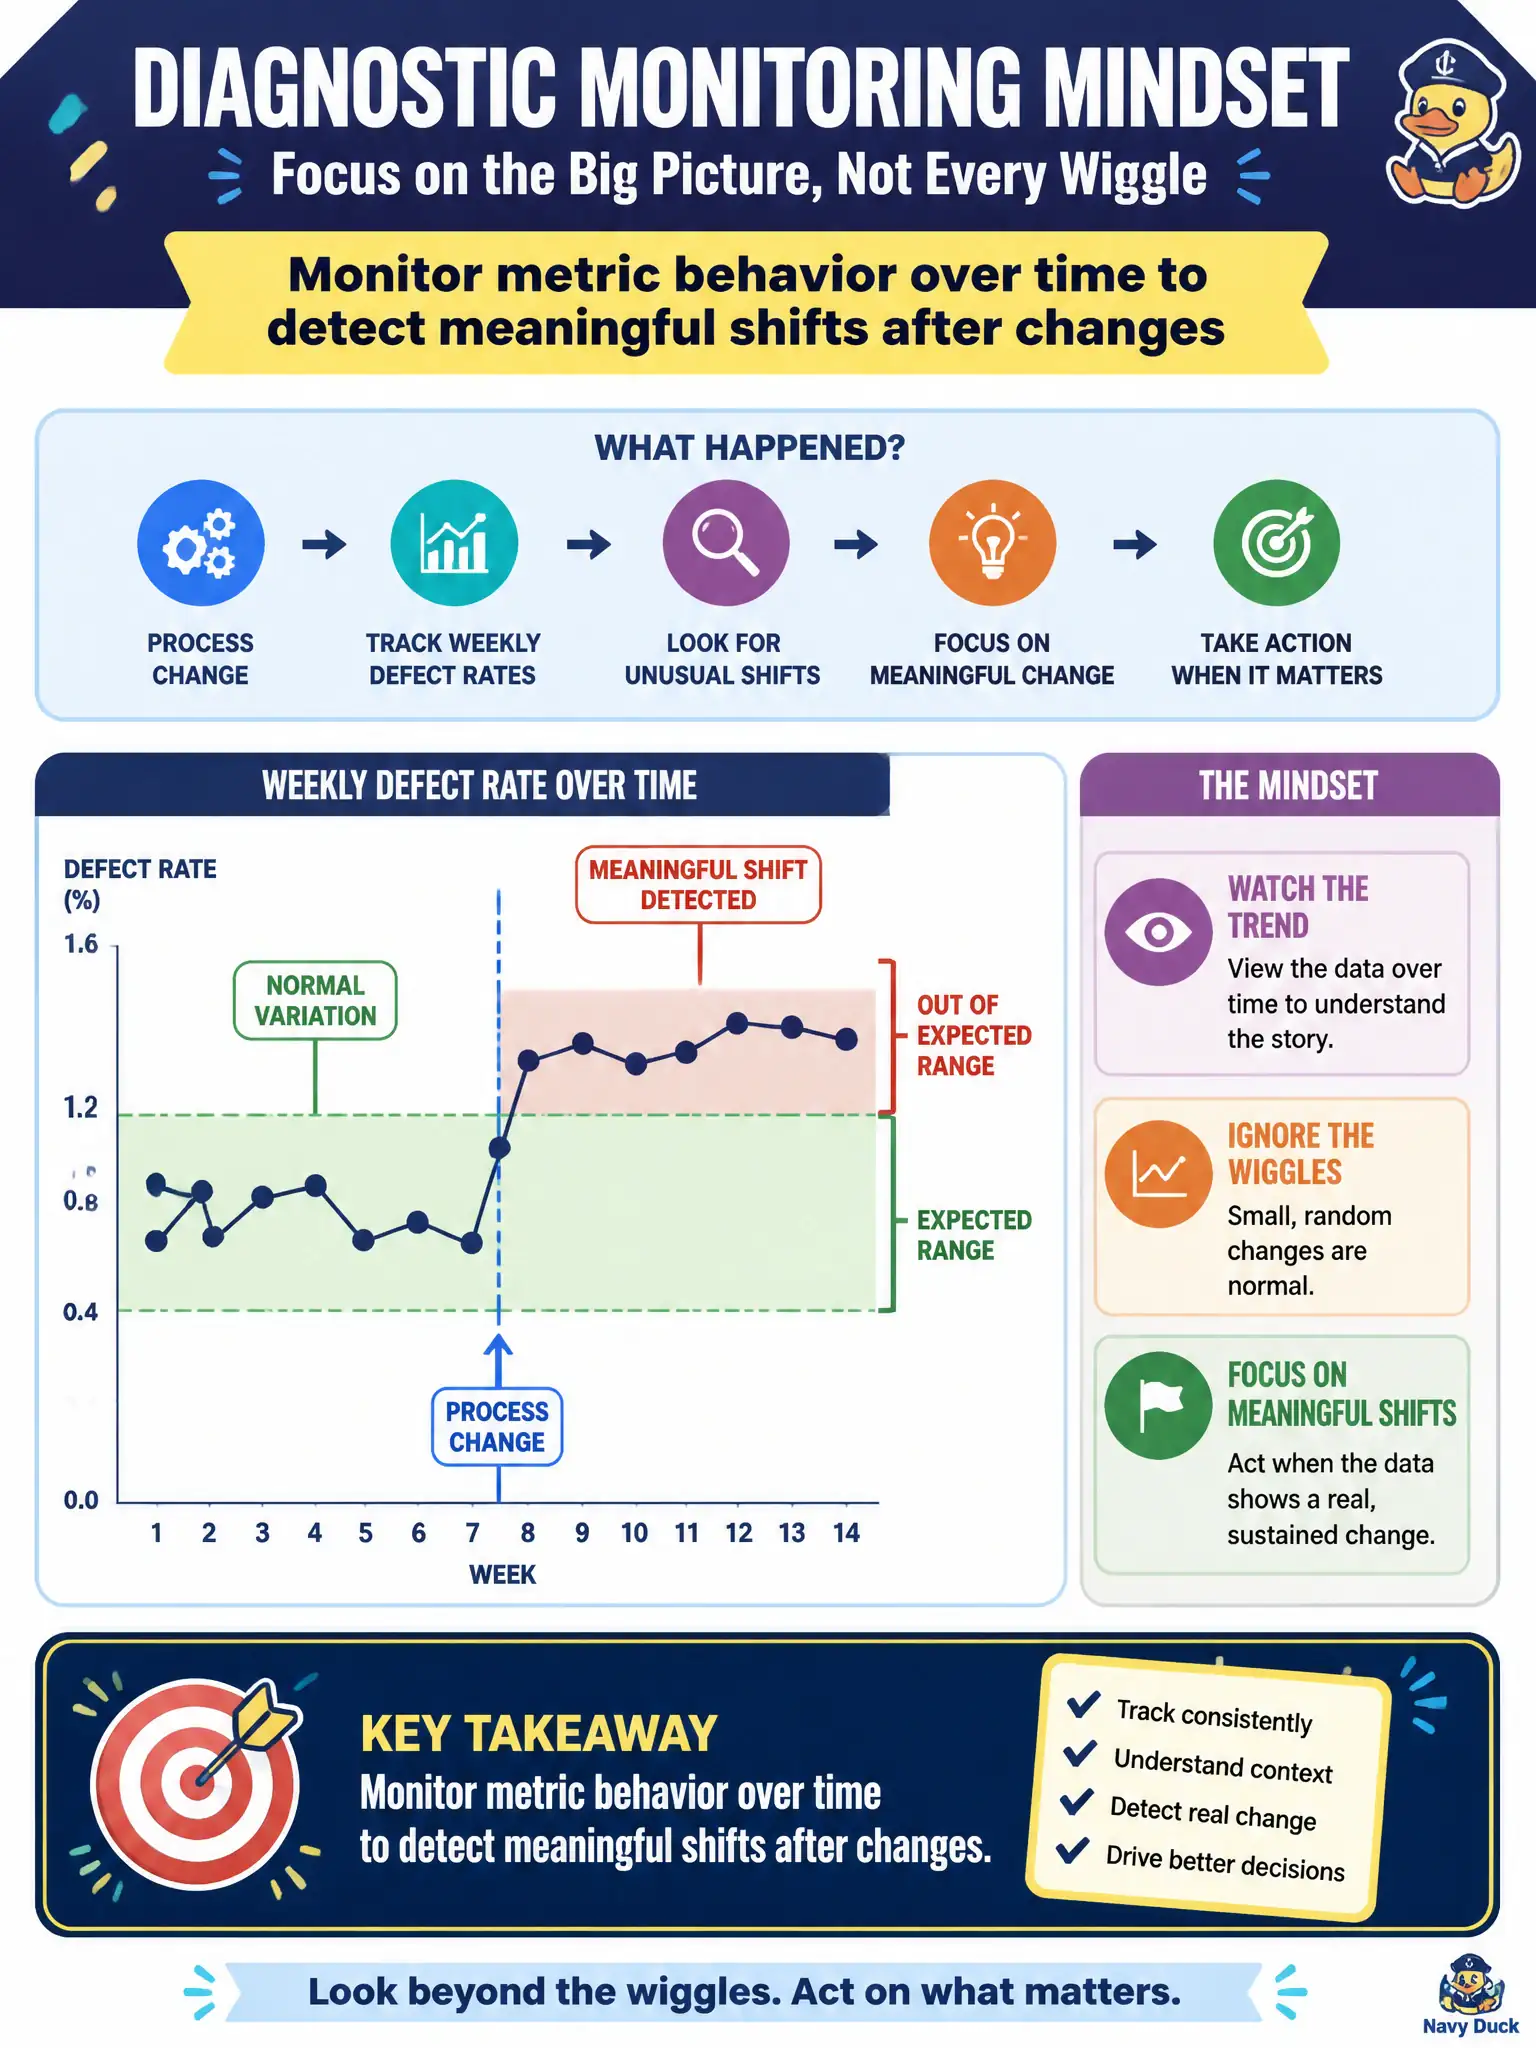
After a process change, a quality team watches weekly defect rates for unusual shifts rather than reacting to every small wiggle. What diagnostic monitoring mindset does this reflect?
Select an answer to reveal the explanation.
Short Explanation
Process charts separate weather from climate—the little wiggles from a real shift after you change the work. Watch the series with that mindset instead of jumping at every bump. Diagnosis needs the timeline, not a single blink.
Full Explanation
After a process change, watching weekly defect rates for unusual shifts rather than reacting to every small wiggle reflects monitoring metric behavior over time to detect meaningful shifts. Diagnostic process monitoring—akin to control-chart thinking—distinguishes routine variation from unusual movement so civic operations do not thrash on noise or miss real regressions after reforms. Ignoring all post-change metrics for at least one year fails by blinding the organization during the highest-risk learning window when defects often surface. Resetting the baseline every day so shifts never appear fails by erasing the comparison needed to detect change. Publishing only the final week’s rate without the preceding series fails by removing temporal context leaders need for judgment. Exam caveat: “meaningful shift” still requires operational judgment and defined rules; monitoring flags candidates and is not a substitute for investigating causes once a shift is flagged. Operational check: chart weekly defect rates with a pre-change baseline, define shift-detection rules with process owners, investigate flagged shifts against the change calendar, avoid reacting to every wiggle, and retain the full series in the operational review pack rather than endpoint-only reporting.