
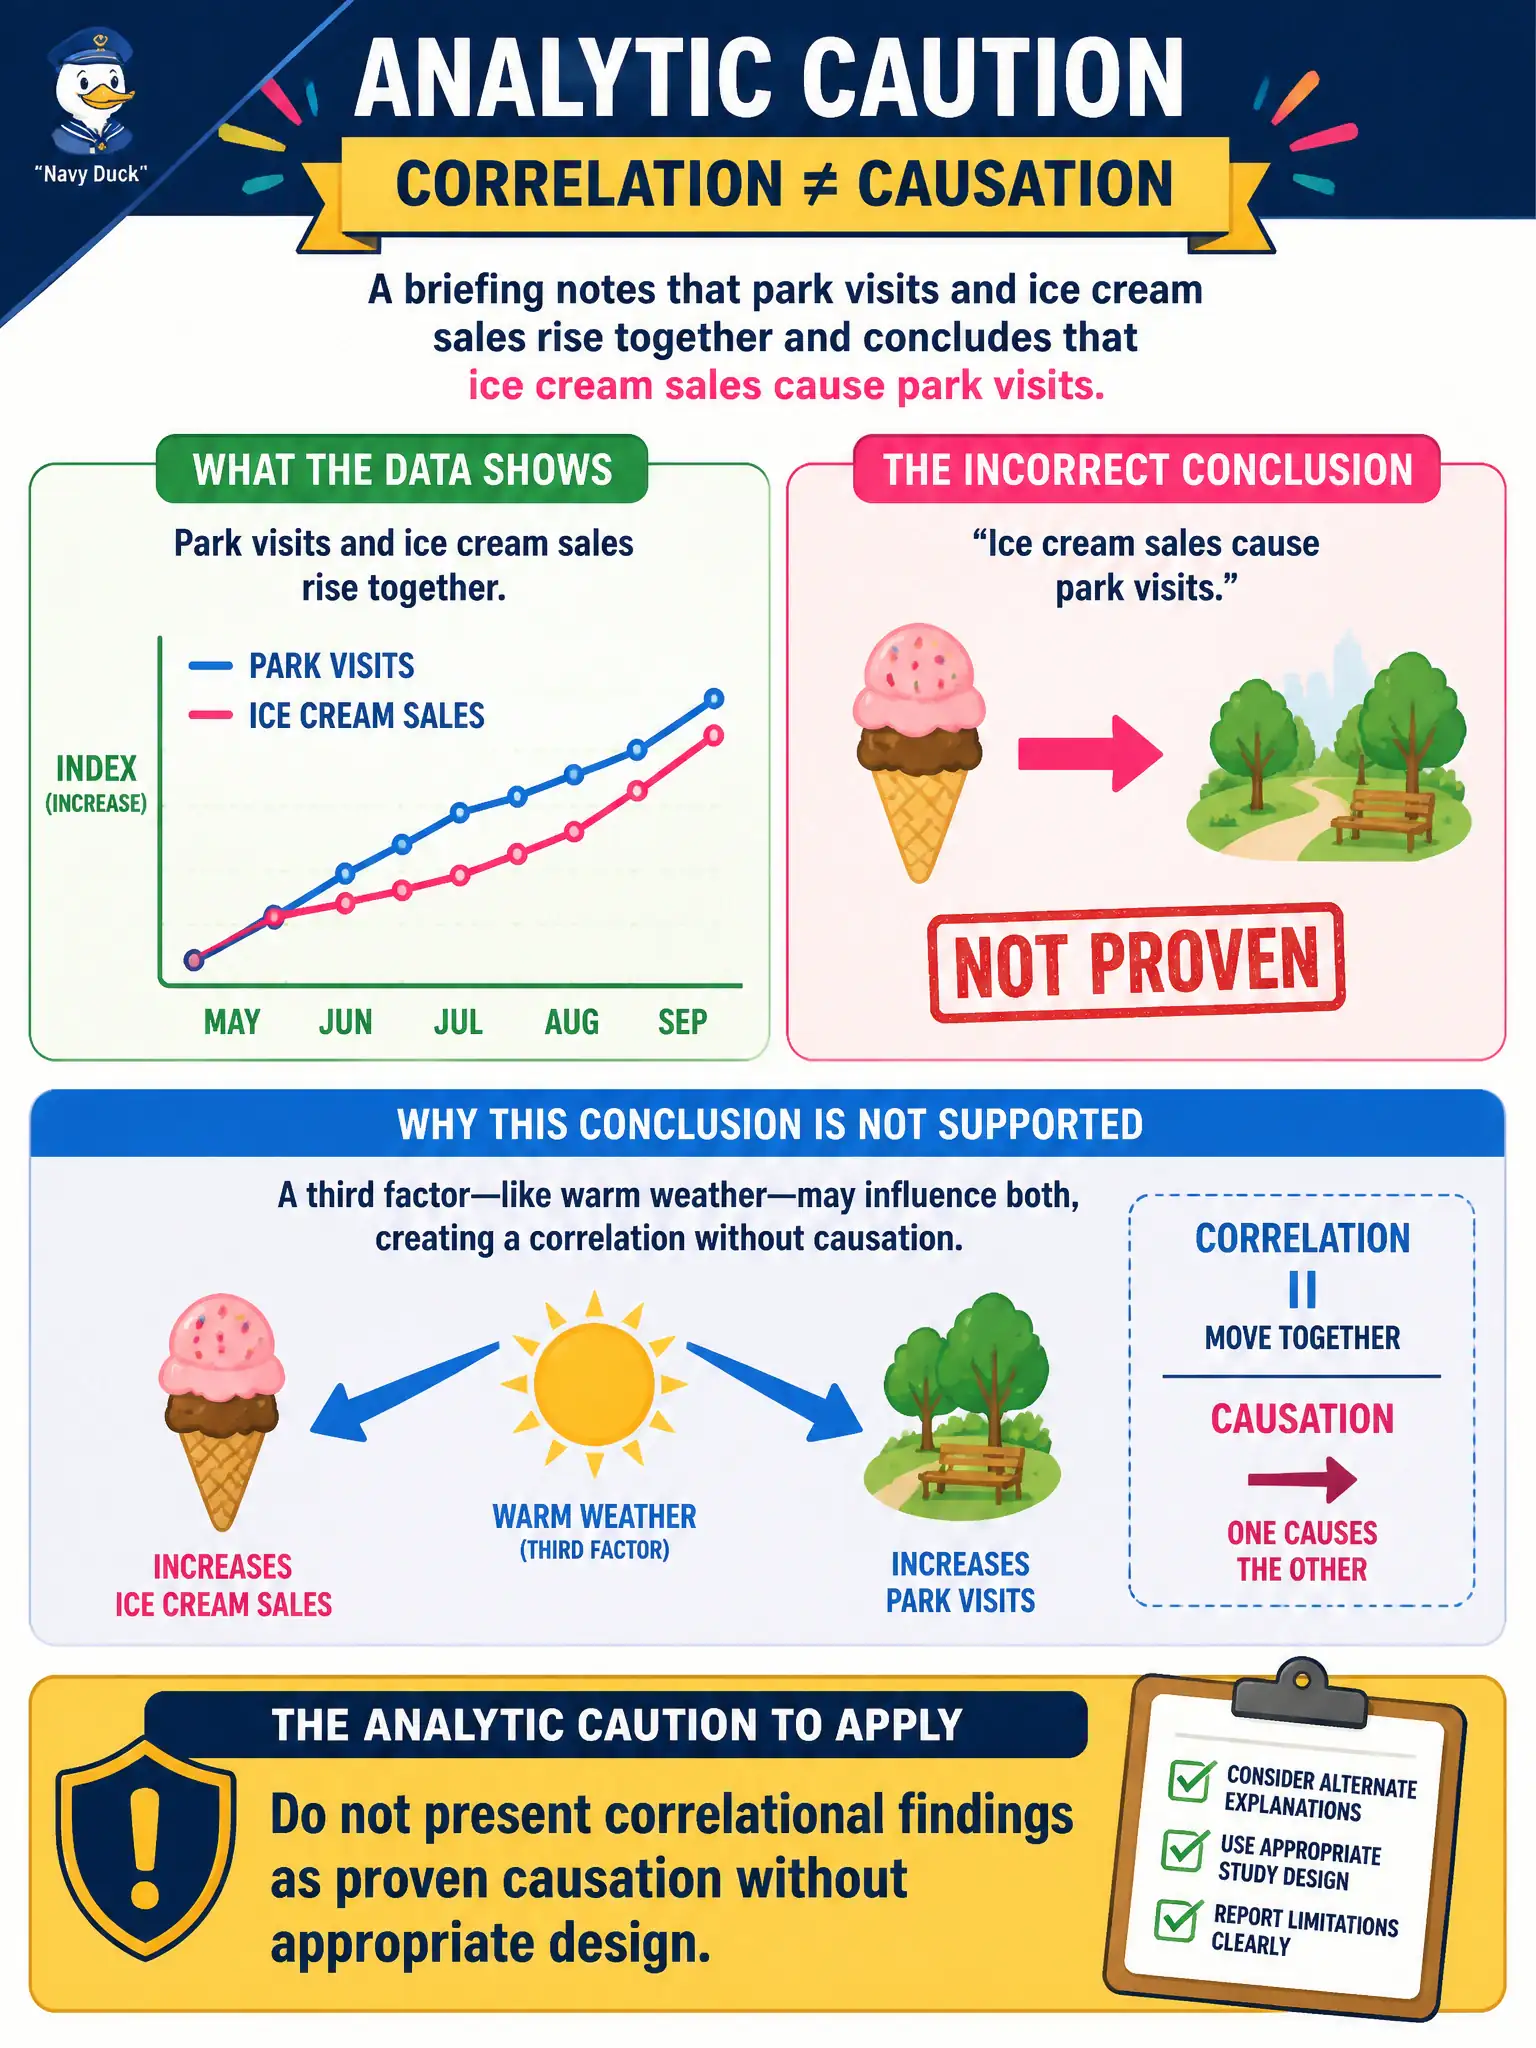
A briefing notes that park visits and ice cream sales rise together and concludes that ice cream sales cause park visits. What analytic caution should the information manager apply?
Select an answer to reveal the explanation.
Short Explanation
Two meters climbing together does not mean one pushes the other—maybe it is just a sunny Saturday. Correlation is a clue, not a verdict. Say what the association shows, and leave causation for designs that can support it.
Full Explanation
A briefing that notes park visits and ice cream sales rise together and concludes that ice cream sales cause park visits requires the information manager to refuse presenting correlational findings as proven causation without appropriate design. Correlation indicates co-movement—often driven by weather, seasonality, or other confounders in civic settings—and does not by itself establish that one variable is a policy lever for the other. Treating any strong correlation as sufficient proof of a causal policy lever fails by overclaiming and risking wasteful or harmful interventions. Banning all correlational charts from civic briefings permanently fails because associations can still be useful hypotheses or descriptive context when claims stay appropriately scoped. Inverting the axes so causation direction becomes visually obvious fails because chart orientation does not create causal evidence. Exam caveat: causal language is appropriate when designs, controls, natural experiments, or validated domain mechanisms support it; the exam rejects leaping from uncontrolled co-movement to “X causes Y” in policy briefings. Operational check: rewrite the briefing to state association only, list plausible confounders such as weather, mark any causal claim as unproven, and require a stronger evaluation design before recommending ice-cream-related interventions to increase park visits.