
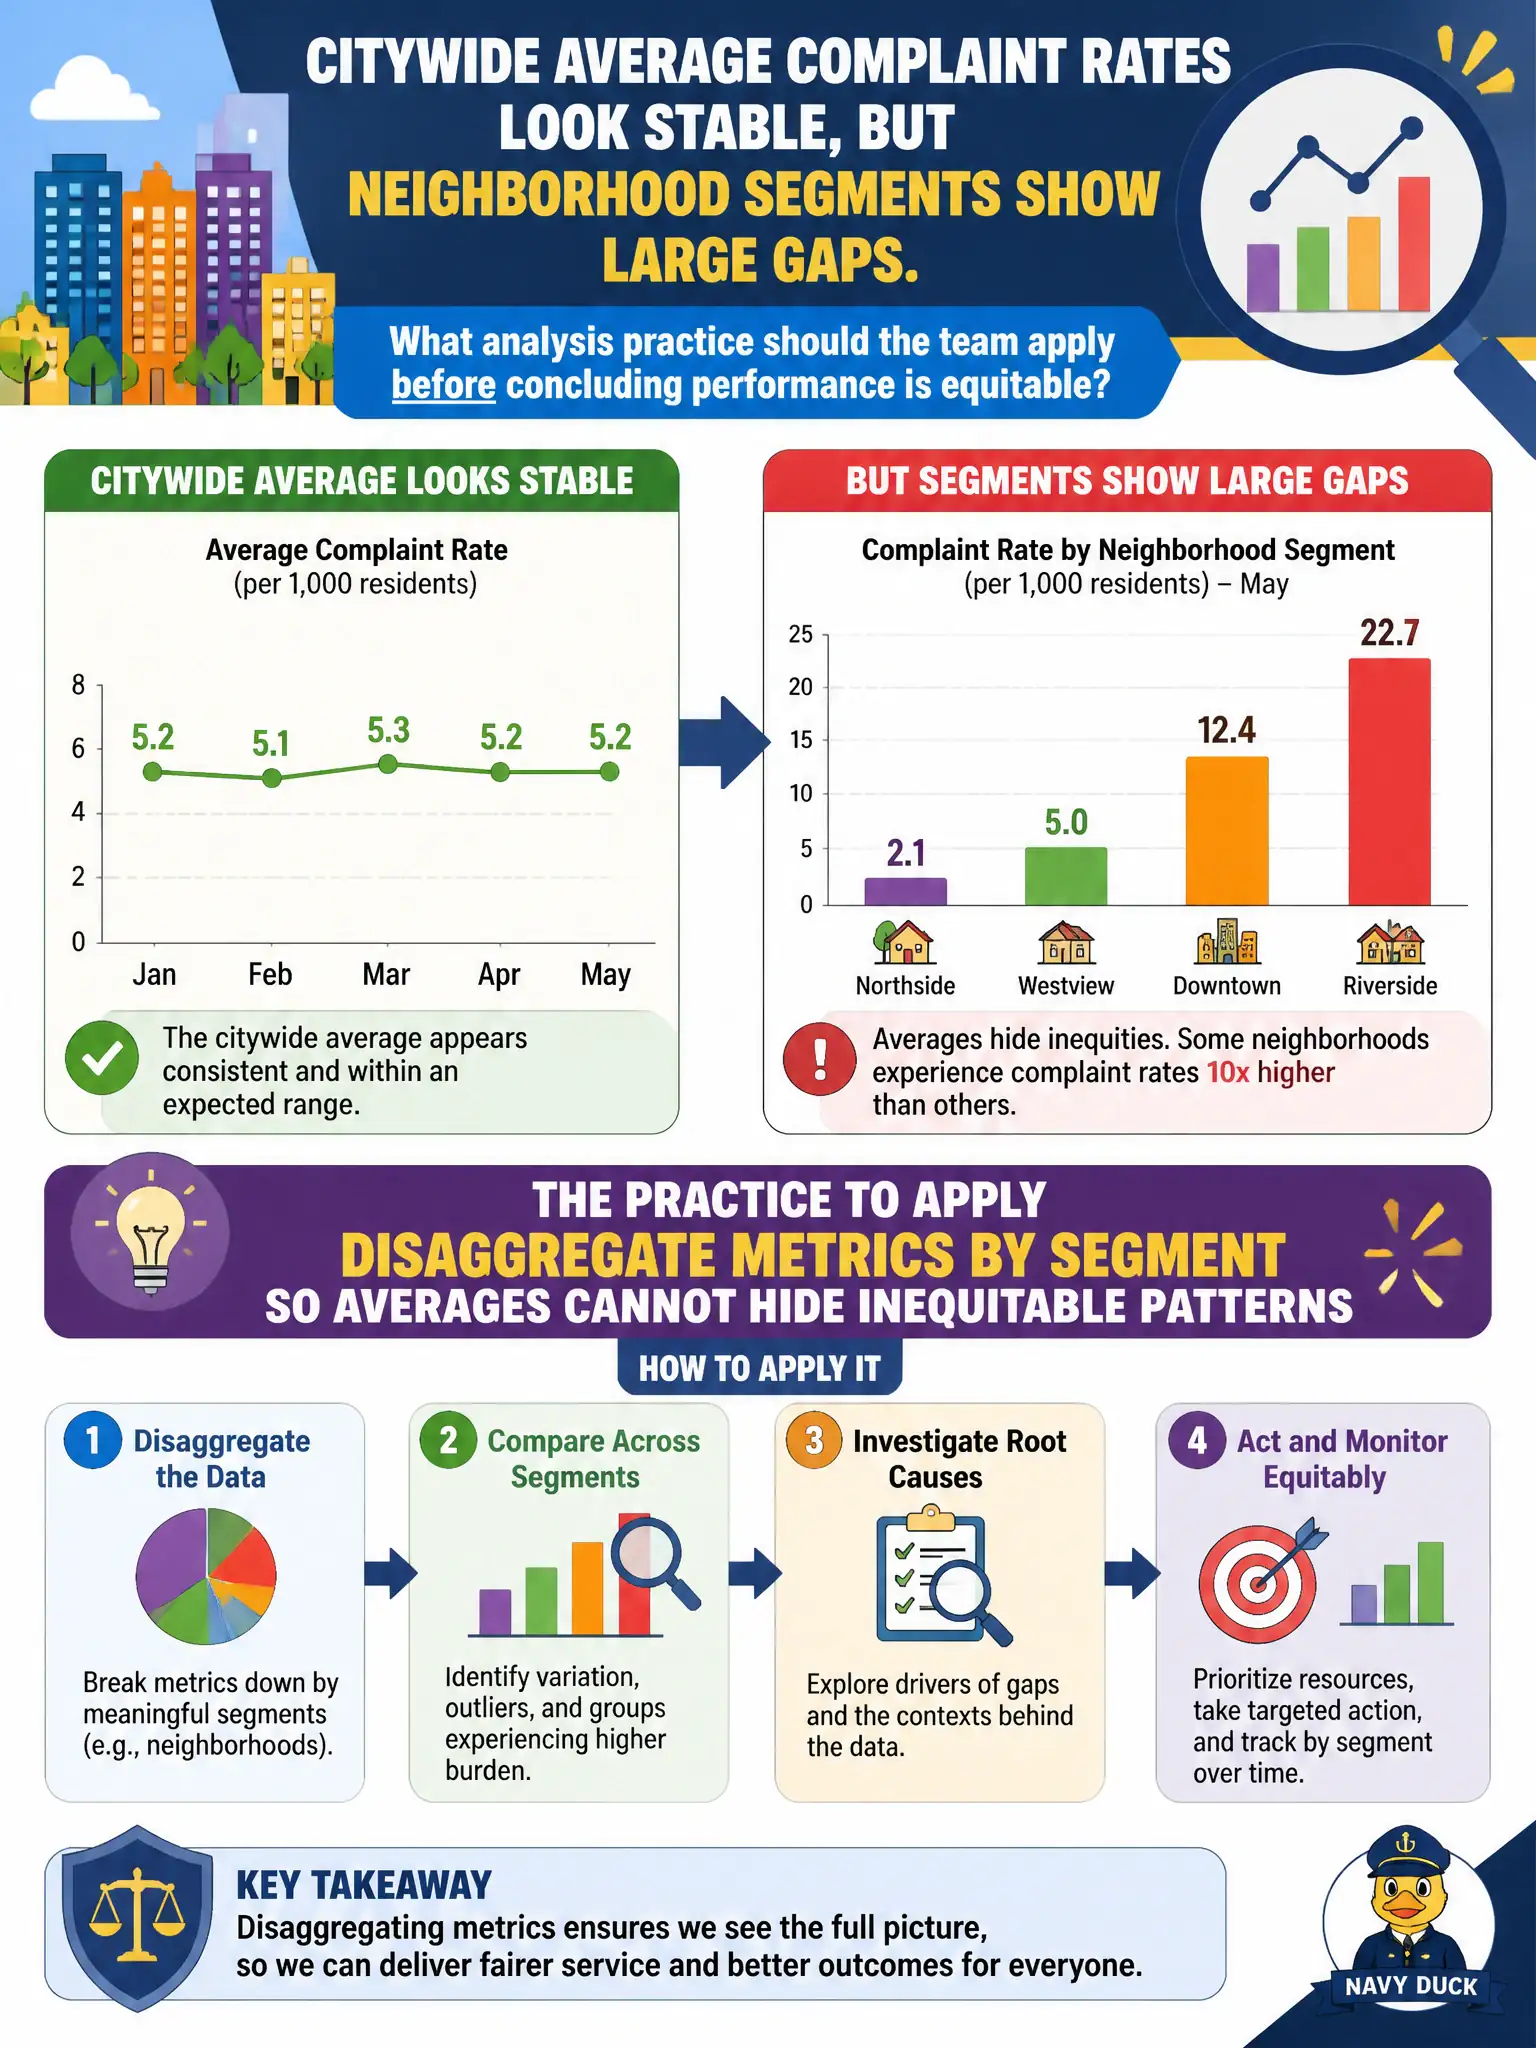
Citywide average complaint rates look stable, but neighborhood segments show large gaps. What analysis practice should the team apply before concluding performance is equitable?
Select an answer to reveal the explanation.
Short Explanation
A citywide average can hide a neighborhood on fire the way a lake average hides a hot spring. Slice the metric before declaring equity. Segmentation turns a smooth line into an honest map.
Full Explanation
Citywide average complaint rates that look stable while neighborhood segments show large gaps require disaggregating metrics by segment so averages cannot hide inequitable patterns before concluding performance is equitable. Segmentation reveals heterogeneity that aggregate means conceal, which matters for civic equity, resource allocation, and trust. Publishing only the citywide average to keep the story simple fails by design when the equity question is about distribution across neighborhoods. Dropping neighborhoods with high complaints from the dataset fails by manufacturing equity through exclusion. Replacing complaint rates with a single happiness survey score fails by substituting an unrelated construct that may not capture service disparity. Exam caveat: disaggregation must respect privacy and small-n suppression rules; very small neighborhoods may need careful grouping, but privacy protection is not a license to publish only flattering citywide averages when equity is the claim. Operational check: produce complaint rates by neighborhood with suppression thresholds, compare gaps to the citywide mean, brief leaders on distribution not only averages, investigate high-gap areas with operational owners, and avoid equity conclusions based solely on a stable citywide mean.