
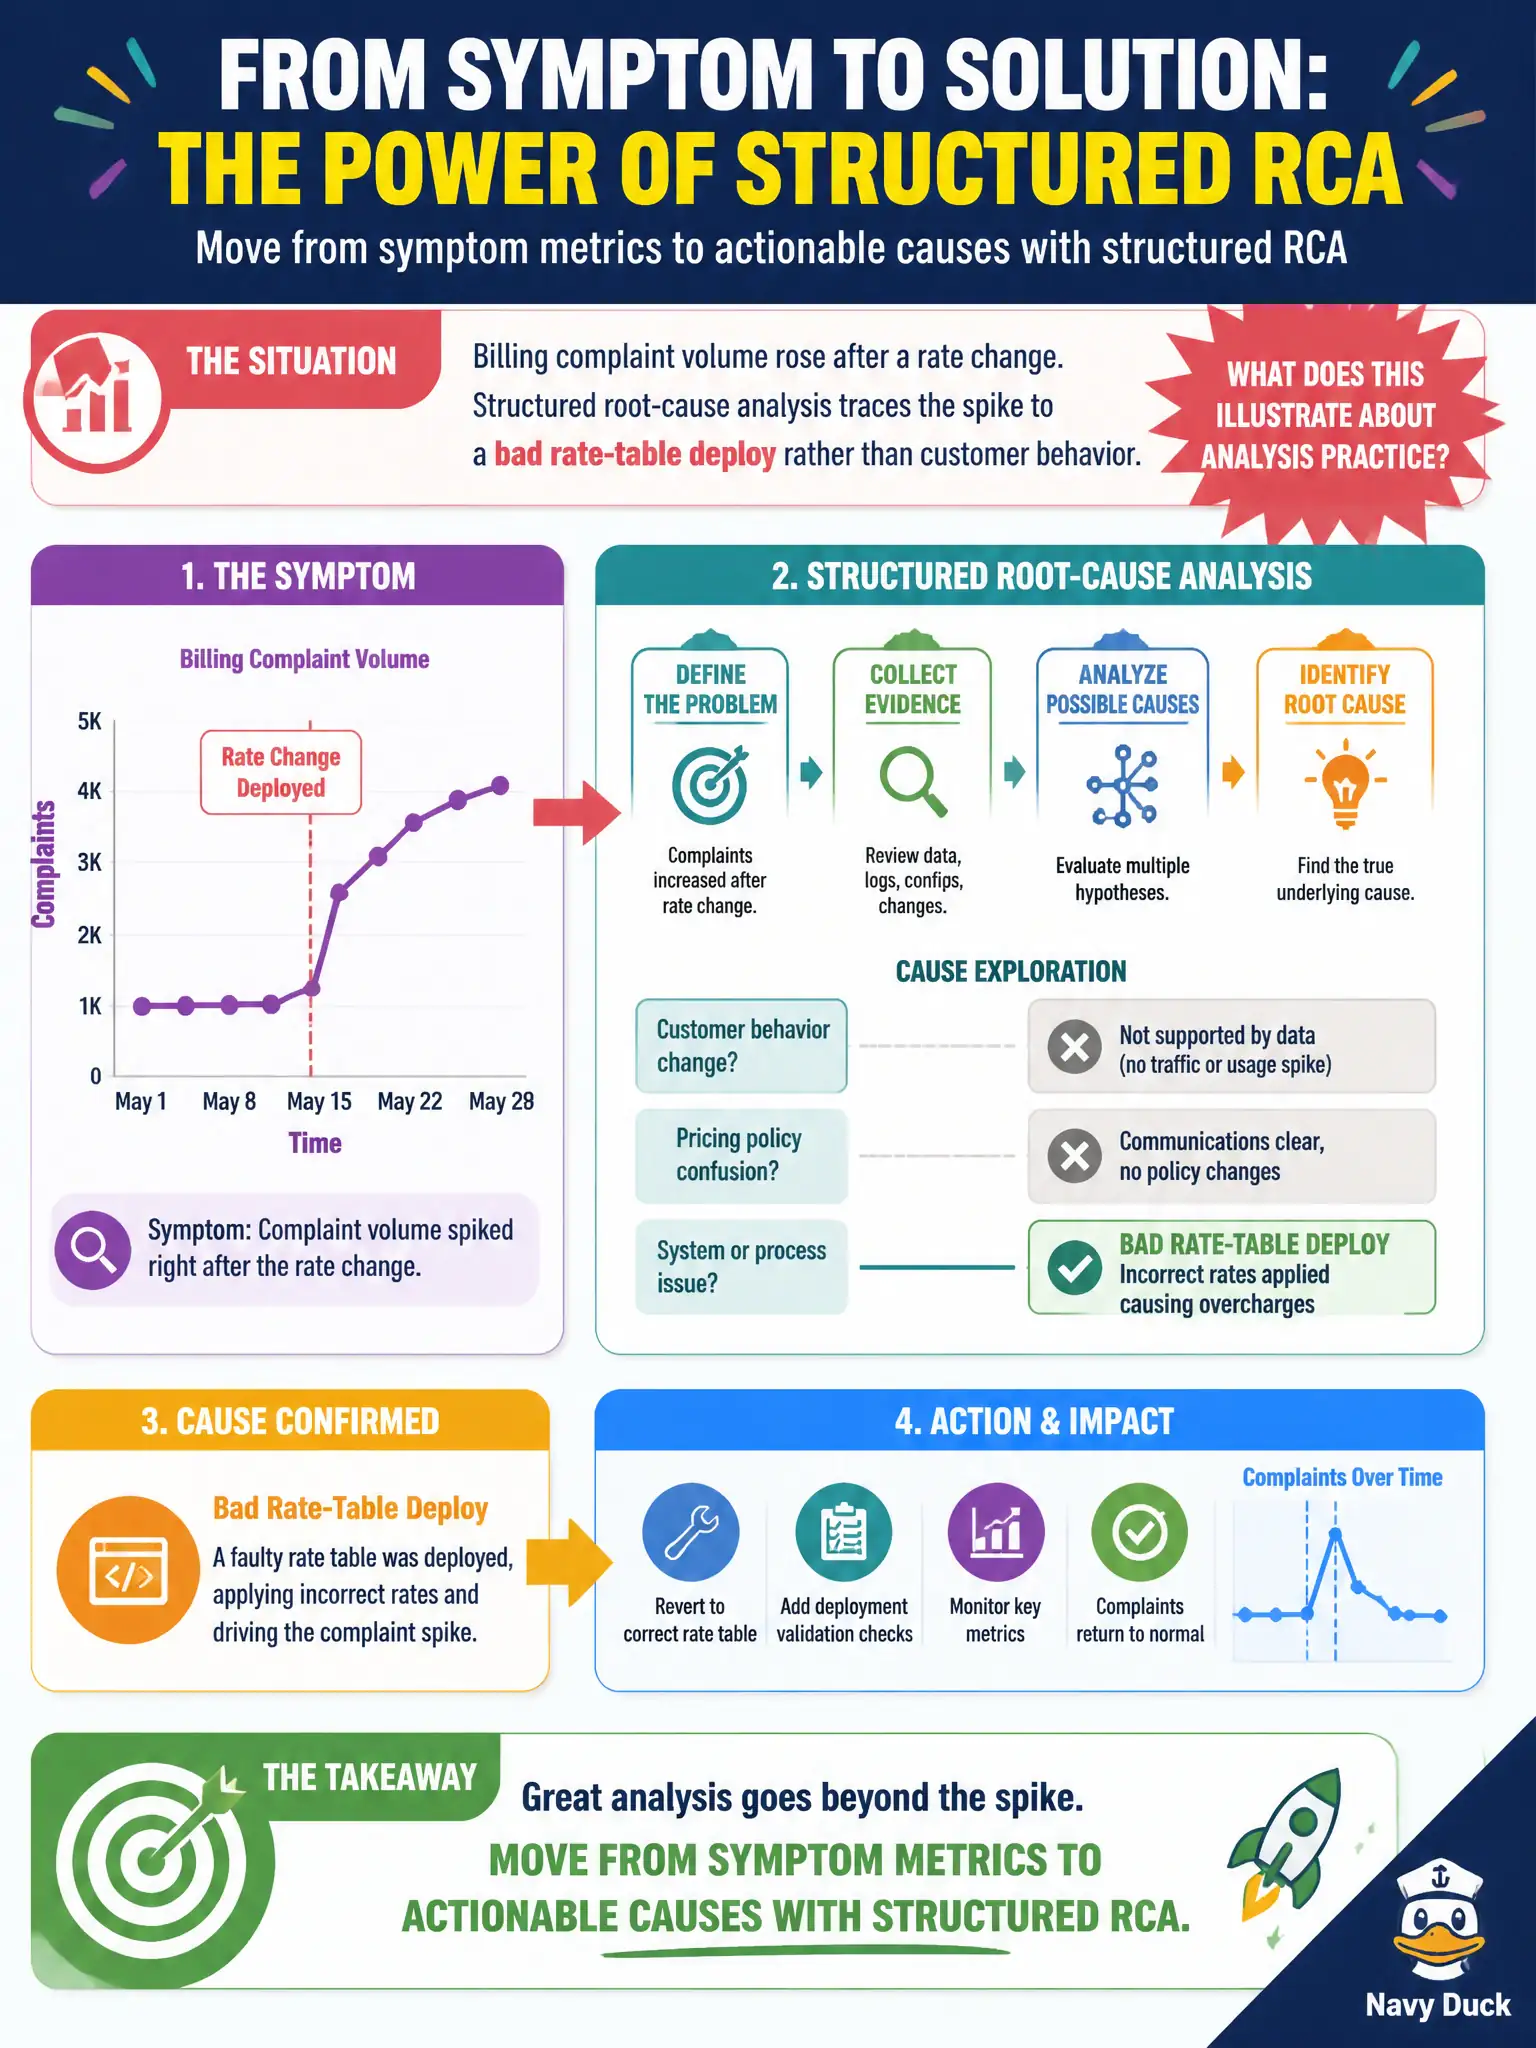
Billing complaint volume rose after a rate change. Structured root-cause analysis traces the spike to a bad rate-table deploy rather than customer behavior. What does this illustrate about analysis practice?
Select an answer to reveal the explanation.
Short Explanation
Complaint counts are the smoke alarm; RCA is walking the house to find the burnt toast. Here the toast was a bad rate-table deploy, not mysterious customer moods. Structured diagnosis turns a noisy metric into something ops can fix.
Full Explanation
Billing complaint volume that rises after a rate change is a symptom metric; structured root-cause analysis that traces the spike to a bad rate-table deploy rather than customer behavior illustrates moving from symptoms to actionable causes. Diagnostic practice examines process evidence, change history, and controllable failure modes so municipal teams can remediate the defect instead of blaming residents. Stopping at the complaint-count chart because volume alone proves customer fault fails by treating a symptom as a verdict and never inspecting deploy or configuration history. Attributing every spike to seasonal demand without inspecting change history fails by substituting a convenient narrative for evidence when a recent rate change is the obvious candidate cause. Replacing RCA with a new vanity metric for social sentiment fails by changing the scoreboard without fixing the broken rate table that drives civic billing pain. Exam caveat: RCA does not require infinite investigation—time-box candidate causes, use change calendars and error logs, and stop when a controllable cause is sufficiently evidenced—but it does reject stopping at the symptom chart. Operational check: after a complaint spike, pull recent rate-table and billing deploys, compare defect timing to complaint onset, validate the bad deploy hypothesis with affected accounts, remediate and re-monitor complaint volume, and record the RCA so similar civic billing incidents are faster to diagnose.