
A team wants to add a widget to their custom Instana dashboard showing the P99 latency trend for their API gateway service over the last 7 days. Which widget type and data source should they configure?
Select an answer to reveal the explanation.
Short Explanation and Infographic
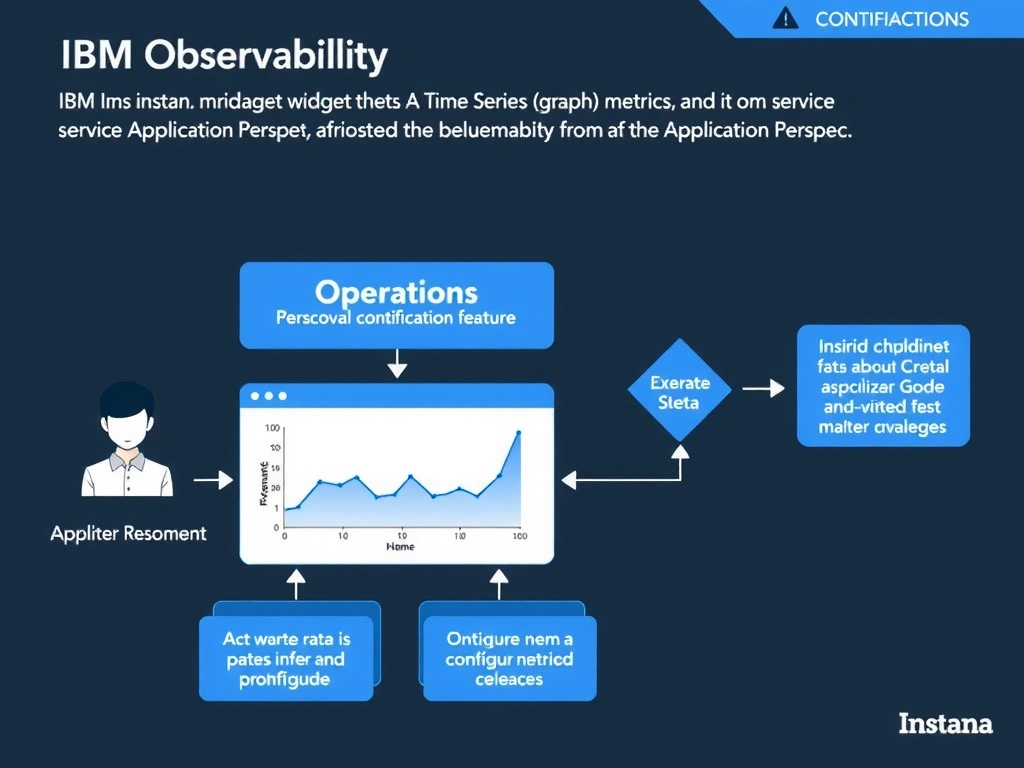
A Time Series widget is the correct widget type for displaying a metric trend over a time range, and the data source should be service or endpoint metrics within the Application Perspective, which captures aggregated latency percentiles (P50, P95, P99) at the service level. Infrastructure metrics capture host-level system metrics like CPU and memory, not application-level latency percentiles. Top List and Events widgets serve different purposes and do not display a time-based latency trend.
Full explanation below image
Full Explanation
A Time Series widget is the correct widget type for displaying a metric trend over a time range, and the data source should be service or endpoint metrics within the Application Perspective, which captures aggregated latency percentiles (P50, P95, P99) at the service level. Infrastructure metrics capture host-level system metrics like CPU and memory, not application-level latency percentiles. Top List and Events widgets serve different purposes and do not display a time-based latency trend. The correct answer is 'A Time Series (graph) widget using service or endpoint metrics from the relevant Application Perspective with P99 latency selected'. The incorrect options — 'A Table widget using Infrastructure host metrics from the server running the API gateway', 'A Top List widget ranked by latency pulled from the Service Map view', 'An Events widget filtered to display only latency-threshold-related events for the gateway' — are wrong because they do not align with IBM Instana's architecture or recommended practices for this scenario. Understanding this concept is essential for the Domain 1: Operations domain of the IBM Instana Observability certification.