
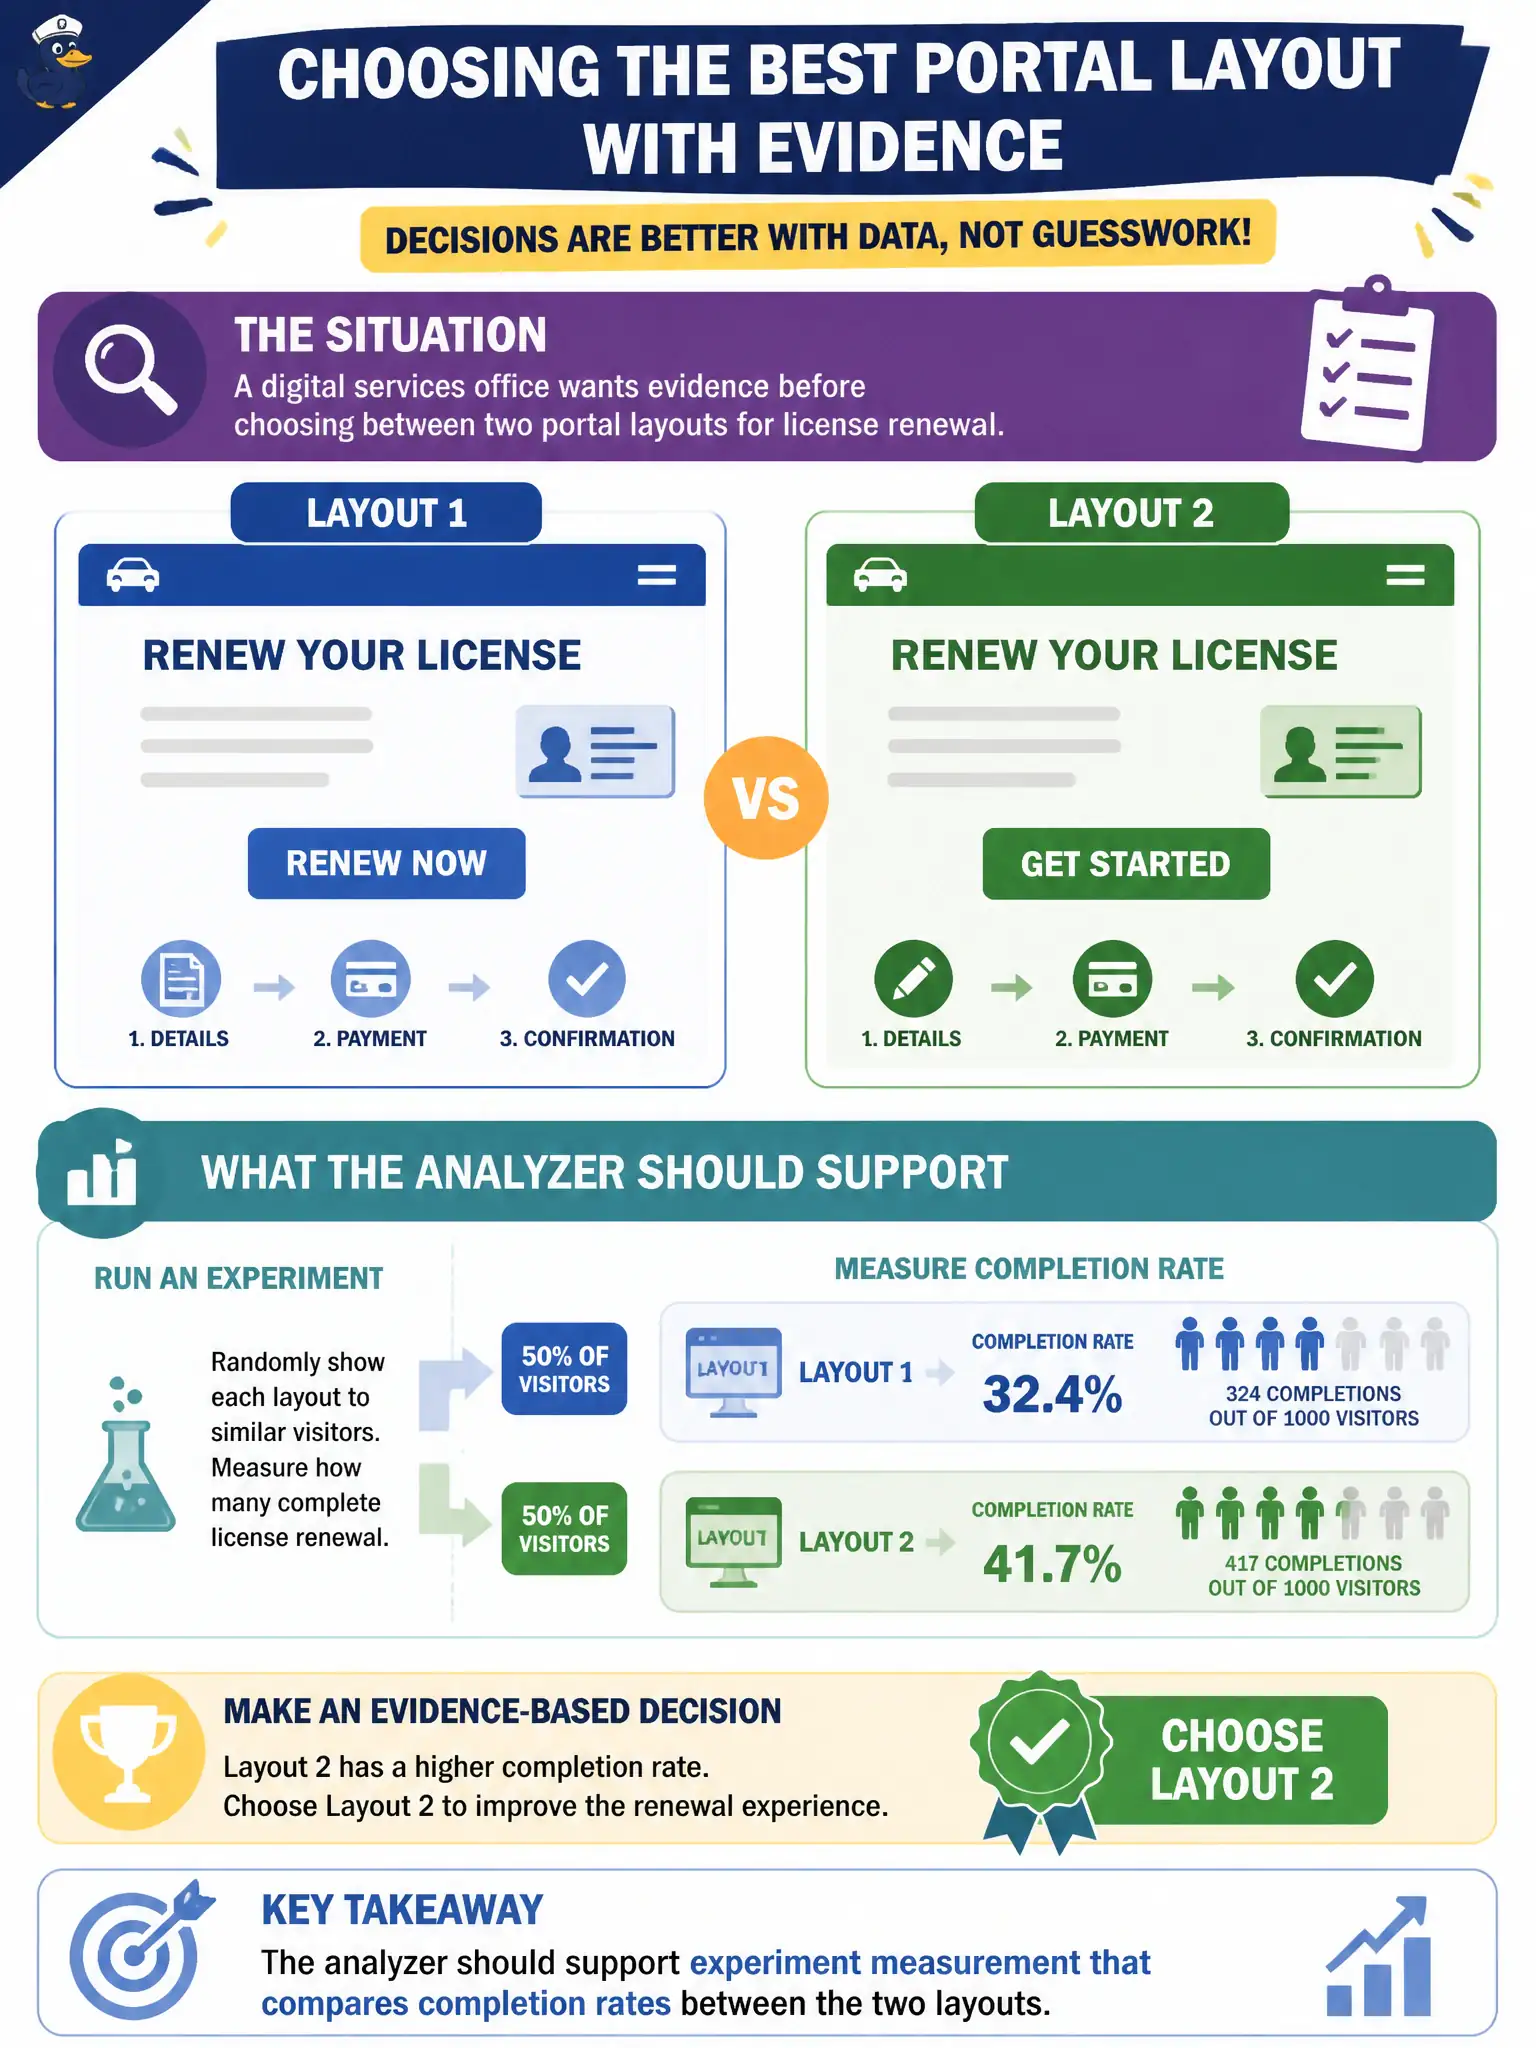
A digital services office wants evidence before choosing between two portal layouts for license renewal. What should the analyzer support?
Select an answer to reveal the explanation.
Short Explanation
A/B tests are just fair races between two front doors. Tag each layout, watch completion, and let the numbers pick the winner—not the loudest meeting. The analyzer’s job is clean measurement so civic UX bets are evidence-based.
Full Explanation
Experiment measurement that compares completion rates between two portal layouts gives a digital services office evidence before choosing a license-renewal design. Controlled comparison—traffic splits or equivalent tests—turns UX preference into outcome data residents feel as completed renewals. Cap. 10 analyzers should support experimentation, not only descriptive charts for municipal portals.
Declaring a winner from a single designer’s preference without traffic splits skips evidence. Measuring only CPU utilization on web servers as layout success confuses infrastructure load with citizen task completion. Hiding both layouts from analytics so no completion rates can be compared prevents the very evidence the office requested for a public service decision.
Exam caveat: experiments need adequate sample size, stable instrumentation, and ethics/privacy review—especially on government portals where equal access matters. Operational check: run a staged A/B test with an experiment id on events, verify completion rates compute per layout, and confirm the losing variant can be switched off without breaking measurement history. Document the verified decision in the municipal architecture runbook so future on-call and audit staff inherit the same standard.