
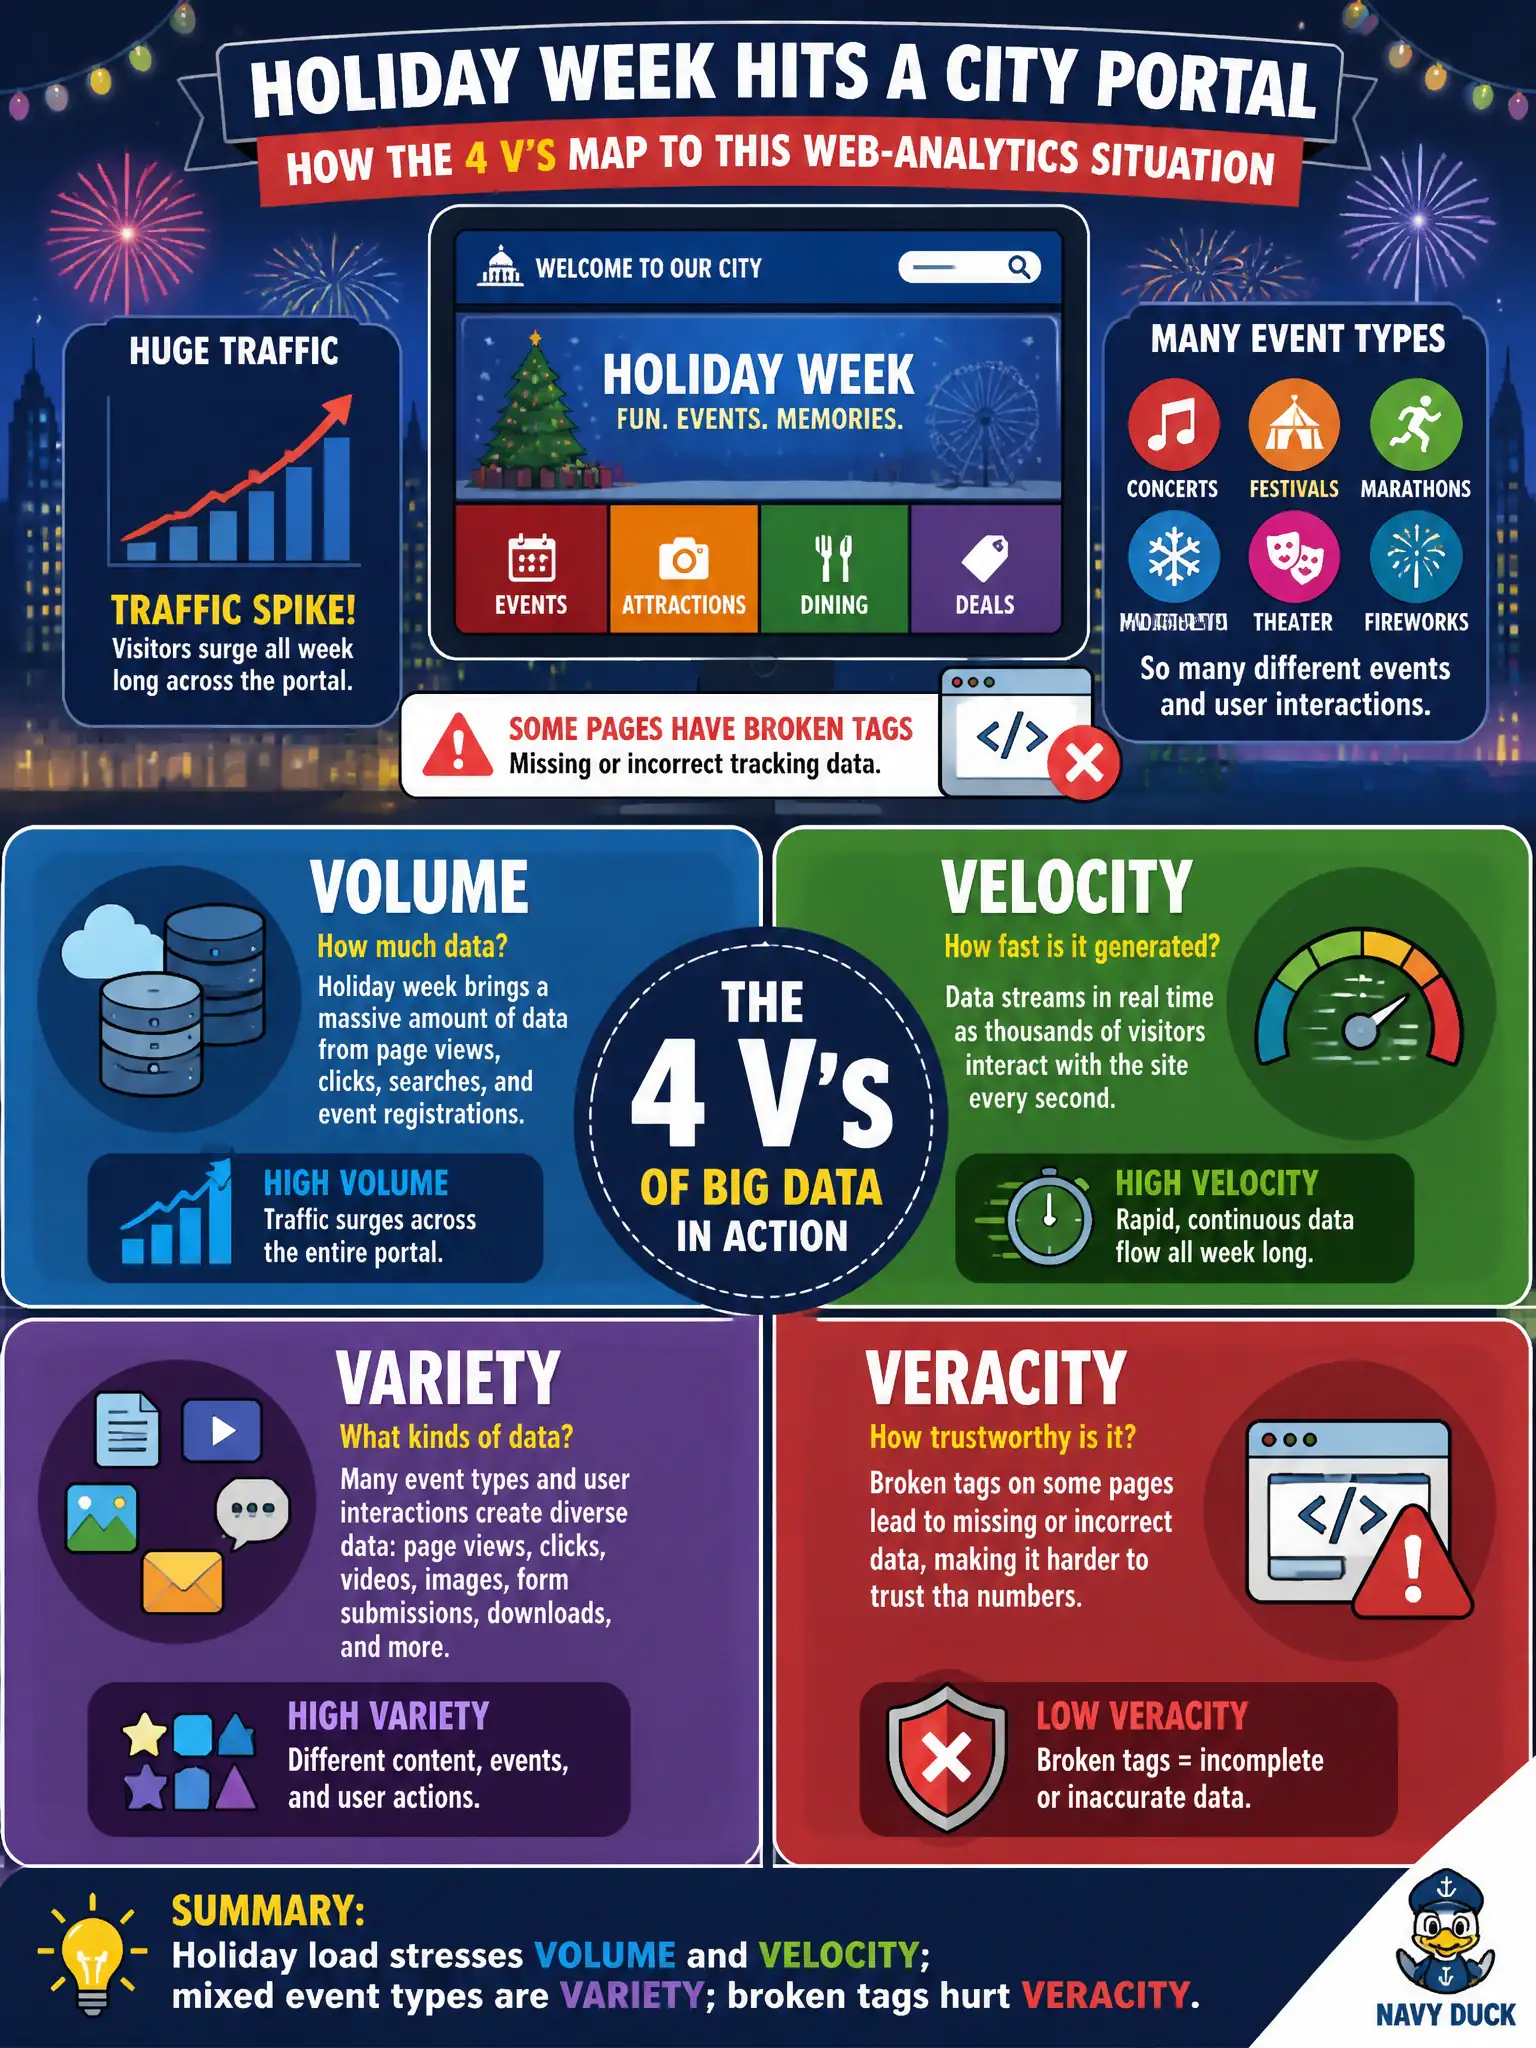
Holiday week hits a city portal with huge traffic, many event types, and broken tags on some pages. How do the 4 V’s map to that web-analytics situation?
Select an answer to reveal the explanation.
Short Explanation
Think of the four V’s as a holiday traffic report card. The crowd is volume and velocity, the mix of clicks and errors is variety, and bad tags punch veracity in the nose. Name the pain with the right V and the fix gets clearer.
Full Explanation
Holiday week on a city portal maps cleanly to the 4 Vs: huge traffic stresses volume and velocity, mixed event types express variety, and broken tags degrade veracity. Web analytics is still Big Data; Cap. 10 expects candidates to apply the Vs to clickstream situations, not treat them as slogans only for Hadoop marketing slides.
Claiming only volume matters and that velocity, variety, and veracity never apply to web logs misses three of the four teaching pillars. Saying broken tags increase volume, holiday peaks reduce variety, and bots improve veracity scrambles the meanings of the Vs. Treating variety as four dashboard colors and dismissing other Vs as marketing slogans trivializes the framework for civic platforms.
Exam caveat: the Vs diagnose different fixes—scale and partitioning for volume/velocity, schema governance for variety, validation and bot filters for veracity—rather than one generic “add servers” response. Operational check: during a load test that also emits a malformed tag, record separate metrics for ingest rate, schema-error rate, and bot-filtered share to show the Vs as distinct operational lenses. Document the verified decision in the municipal architecture runbook so future on-call and audit staff inherit the same standard.