
A city wants a web-analyzer application that shows how residents use the municipal portal. Which end-to-end purpose best describes that architecture?
Select an answer to reveal the explanation.
Short Explanation
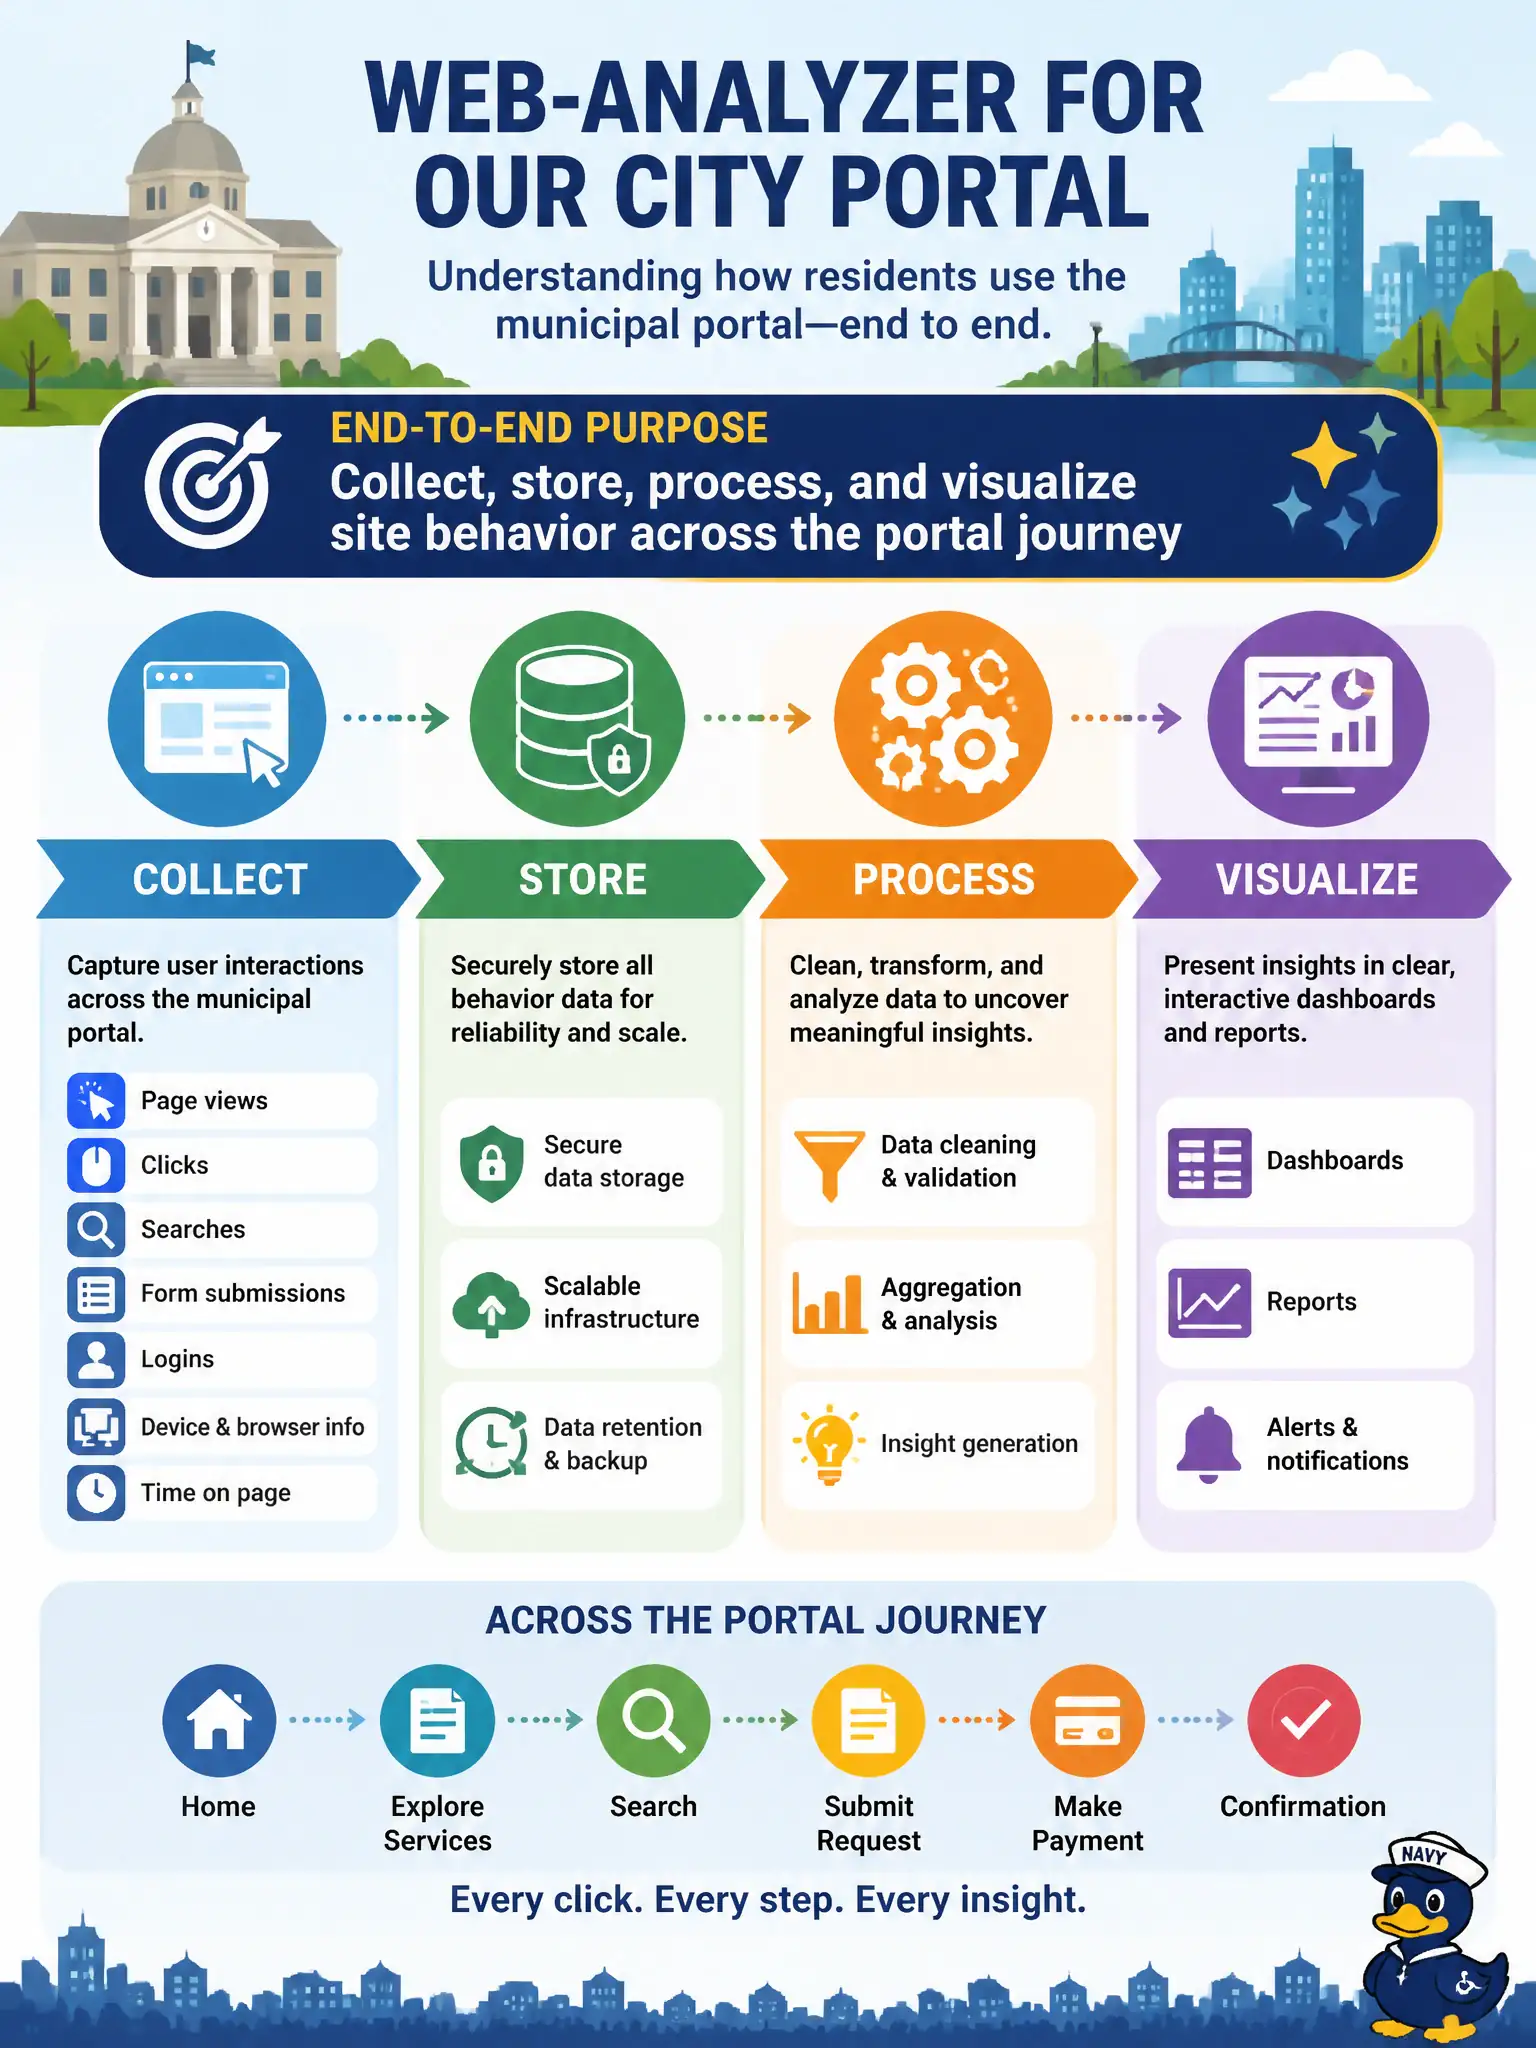
A web analyzer is the city’s trail camera for clicks and page views. It collects behavior, stores it, processes it, and turns it into visuals leaders can use. Brochure-only sites with no measurement leave the trail blank.
Full Explanation
A municipal portal web-analyzer application exists to collect, store, process, and visualize how residents use the site across their journey. That end-to-end purpose mirrors layered Big Data architecture applied to clickstream: capture behavior, land it, transform it, and serve insights that improve digital services. Chapter 10 awareness begins with this applied purpose rather than with a single widget or vendor console.
Replacing every relational database with handwritten paper counters abandons digital measurement and cannot scale to portal traffic. Serving only static brochure pages with no measurement of behavior leaves UX and product teams without evidence. Blocking all analytics so portal improvements rely solely on anecdotes rejects the analyzer’s reason to exist in a data-informed city.
Exam caveat: collection must still honor privacy notices and minimization; “measure the journey” does not mean capturing every form field or identity attribute by default. Operational check: walk a sample citizen task on a staging portal, confirm events appear through collect→store→process→serve, and verify a dashboard metric moves for that task without exposing unnecessary PII. Keep the layer diagram in the service catalog so new portal features inherit the same path.