
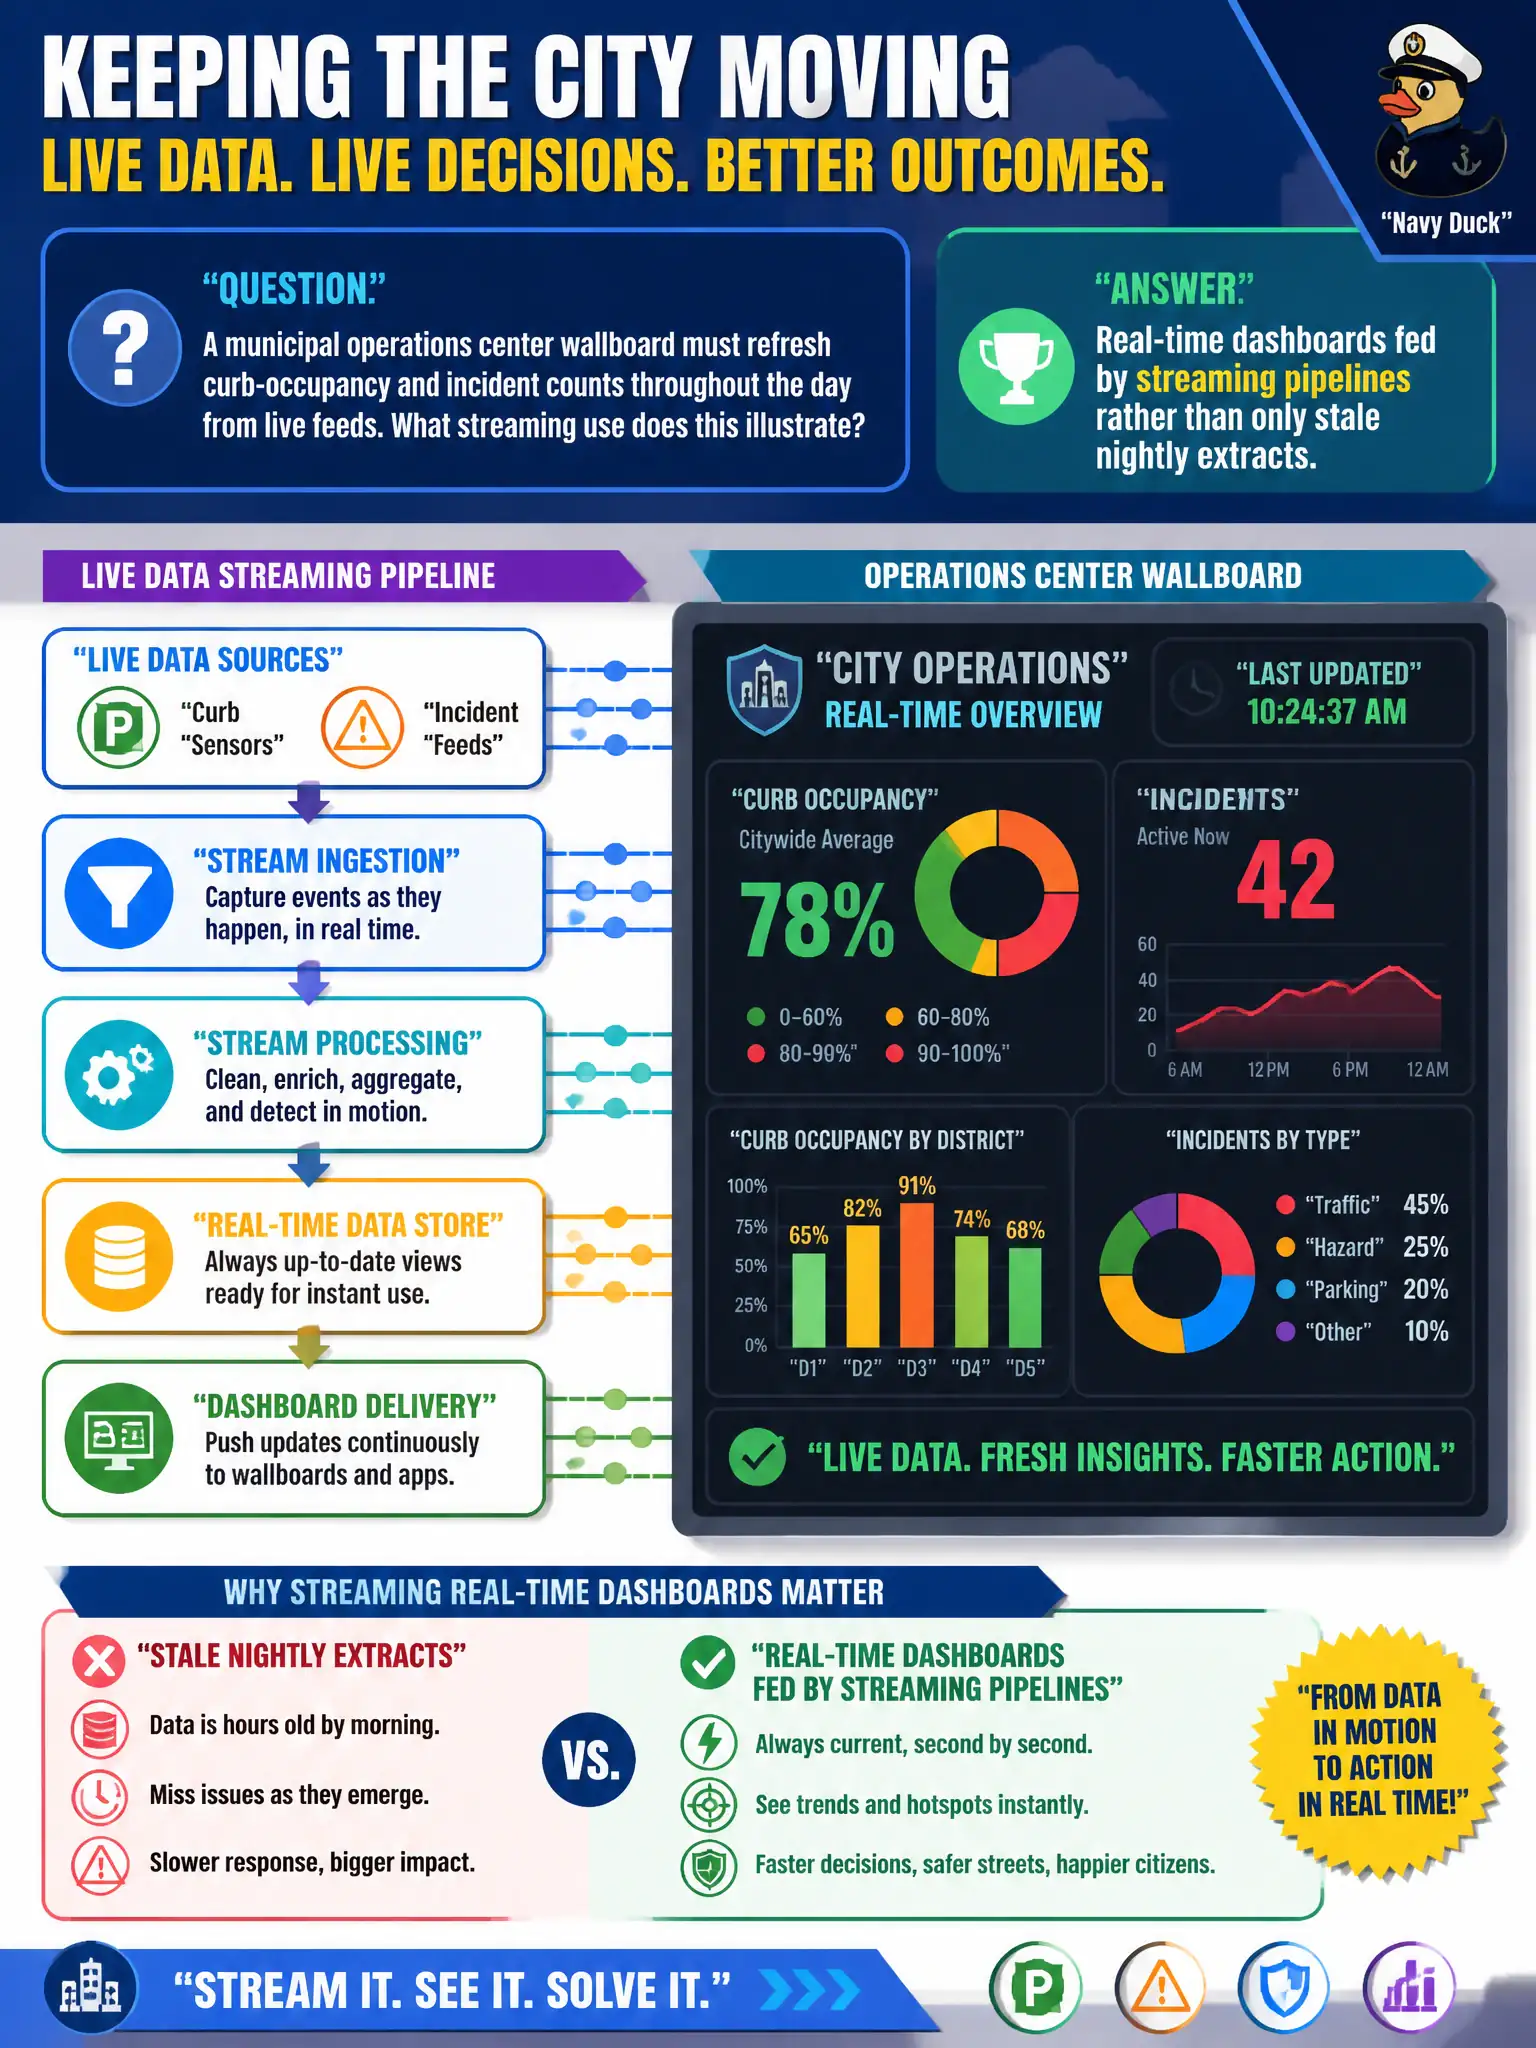
A municipal operations center wallboard must refresh curb-occupancy and incident counts throughout the day from live feeds. What streaming use does this illustrate?
Select an answer to reveal the explanation.
Short Explanation
Ops wallboards that keep twitching with fresh curb and incident numbers are stream-fed dashboards. They sip the live pipeline instead of waiting on last night’s extract. Atlases and chalkboards are charming—and not this pattern.
Full Explanation
A municipal operations center wallboard that refreshes curb-occupancy and incident counts throughout the day from live feeds illustrates real-time dashboards fed by streaming pipelines rather than only stale nightly extracts. Decision makers see current conditions, not yesterday’s batch. Dashboards that update solely from annual printed atlases cannot support day-of operations. Claiming wallboards cannot consume stream data at all contradicts common city SOC and traffic-center designs. Replacing all sensors with handwritten chalkboard tallies abandons automated telemetry. Exam caveat: dashboard freshness depends on windowing and aggregation lag—label “as of” times so operators do not treat slightly delayed counts as instantaneous truth. Operational check: compare wallboard numbers to a known live sensor sample during a drill, verify refresh within the stated SLA, and ensure overnight batch extracts are not the only update path. In production terms for streaming operations wallboards, assign an owning team, wire a dashboard that shows the pattern is healthy under peak civic load, and require a staging drill that rehearses failure and recovery before resident impact. Revisit the choice when traffic shape, retention, or integrity needs change, and keep a named rollback owner on the change record. Re-test both the happy path and the failure path for streaming operations wallboards after material dependency upgrades so regressions are caught before the next public release.