
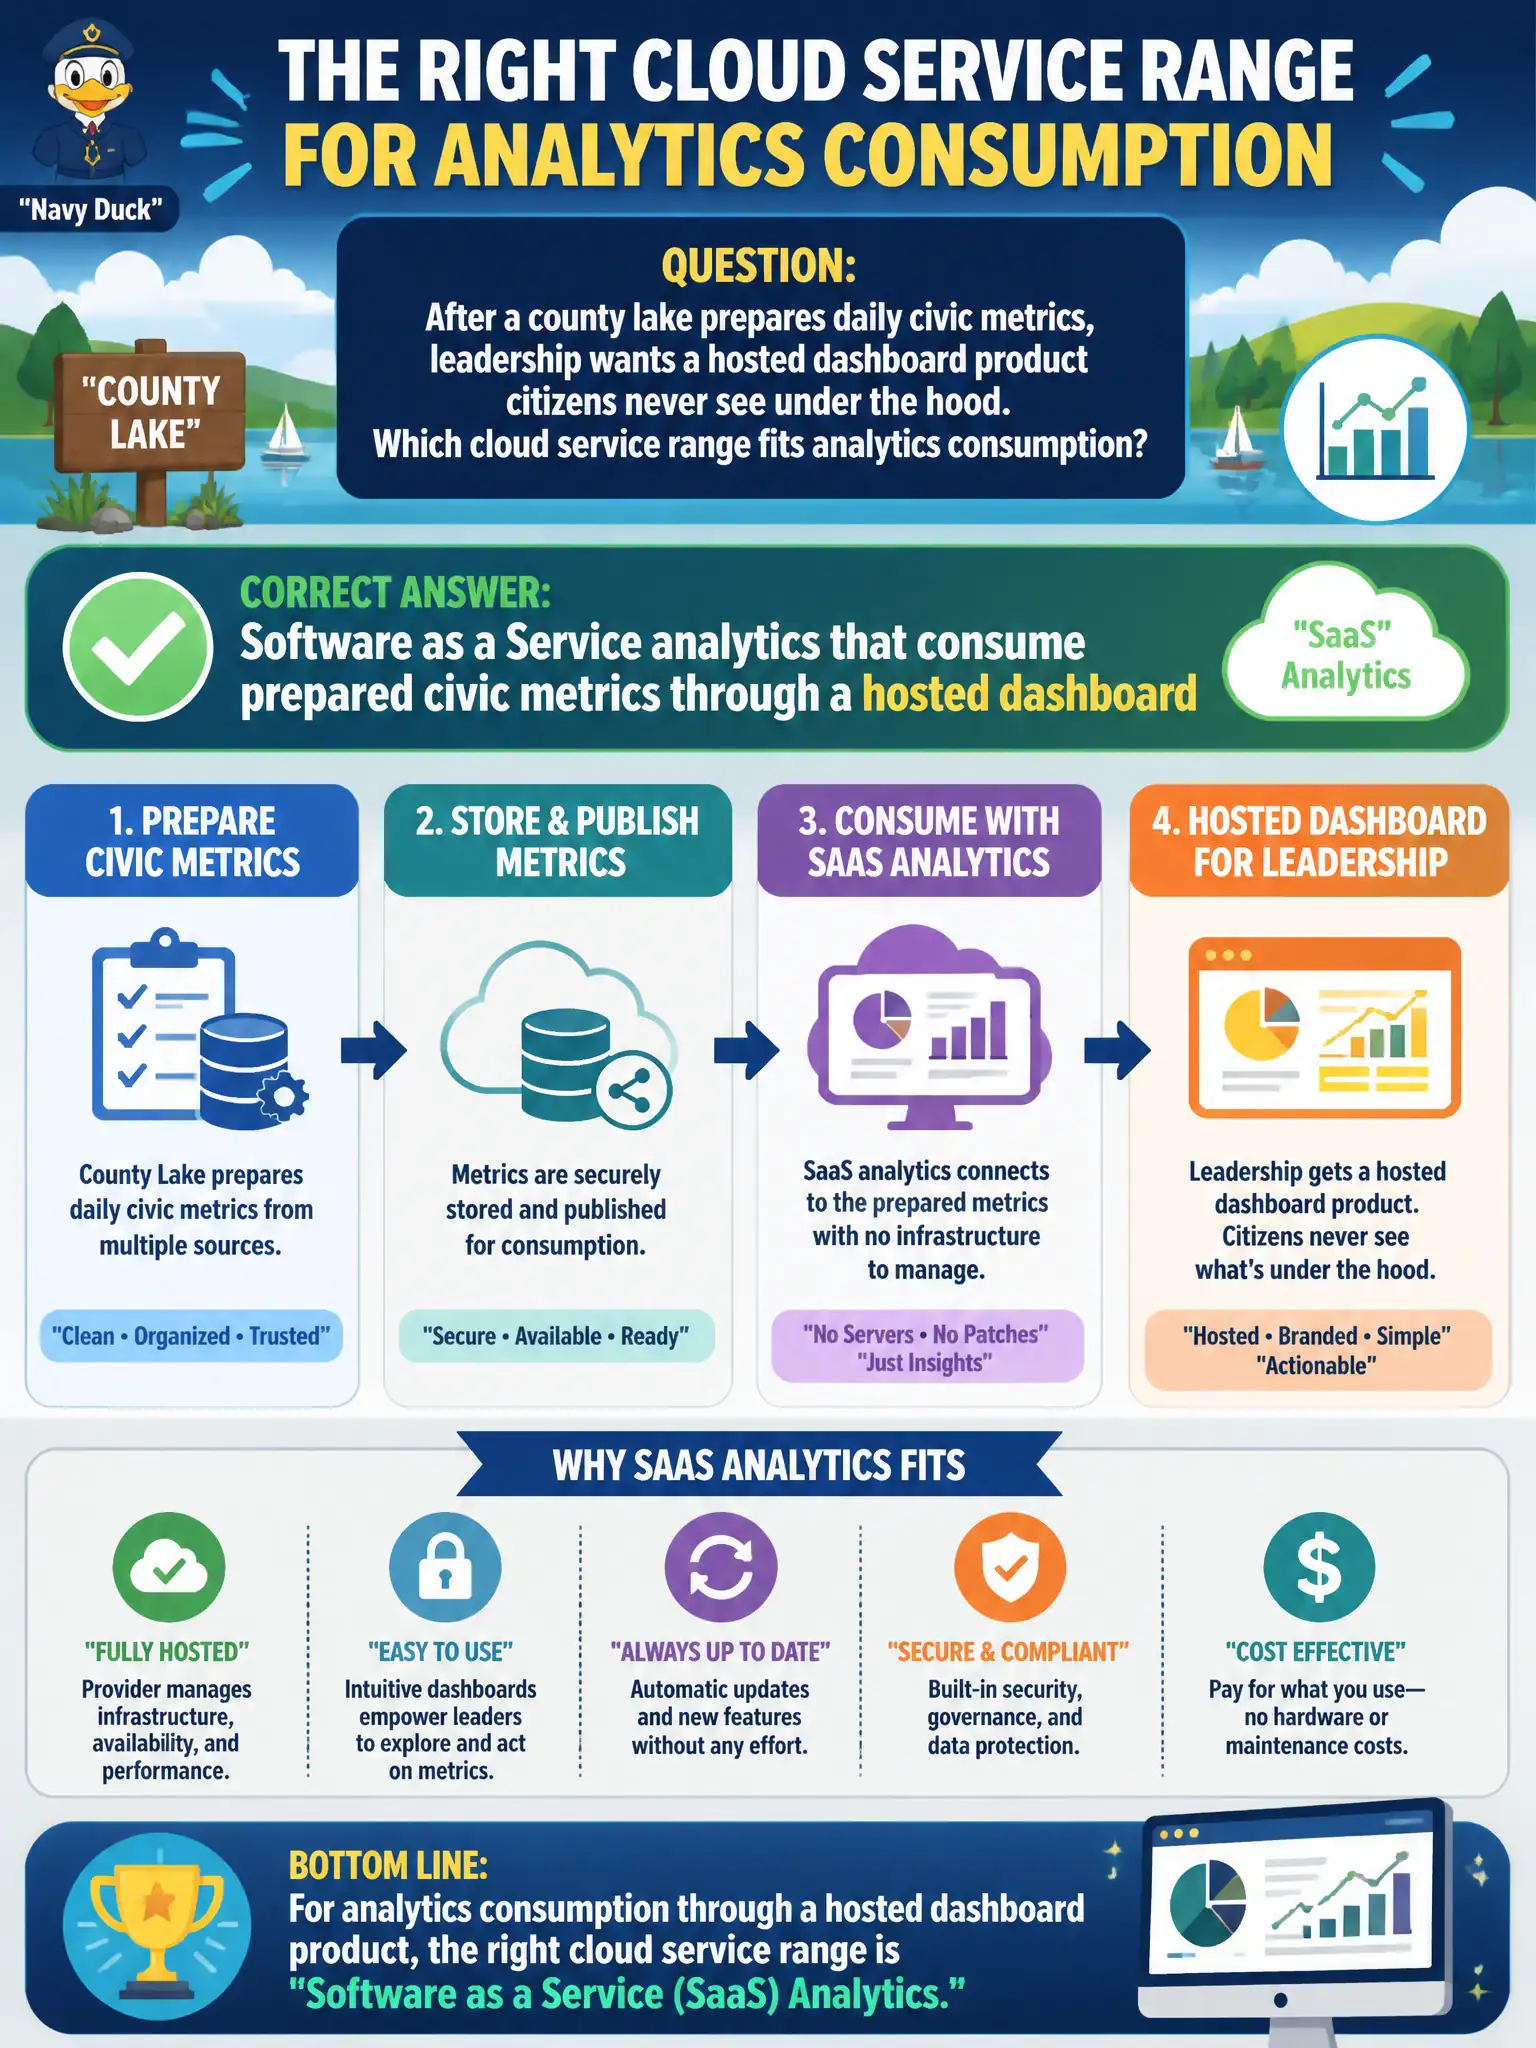
After a county lake prepares daily civic metrics, leadership wants a hosted dashboard product citizens never see under the hood. Which cloud service range fits analytics consumption?
Select an answer to reveal the explanation.
Short Explanation
Think of buying a finished weather app instead of wiring your own sensors. SaaS analytics sit on top of prepared metrics and serve charts without exposing the plumbing. Storage accounts and DIY brokers are lower layers, not the consumption product itself.
Full Explanation
Software as a Service analytics consume prepared civic metrics through a hosted dashboard product that citizens and leaders never see under the hood. After a county lake prepares daily metrics, SaaS sits at the consumption layer: charts, sharing, and light configuration without exposing brokers or cluster plumbing. Chapter 9 service-range framing places SaaS above IaaS and PaaS for finished analytical consumption.
Infrastructure as a Service storage accounts used only as cold tape equivalents provide durable landing capacity, not a hosted dashboard consumption product. Platform as a Service stream brokers that the dashboard team must still configure topic by topic remain mid-stack plumbing rather than finished analytics SaaS. Bare-metal colocation that forces every chart library onto city-owned racks recreates undifferentiated heavy lifting instead of a hosted consumption experience.
Exam caveat: SaaS dashboards still inherit data-quality and access-control obligations—the city remains responsible for what metrics mean and who may see resident-adjacent aggregates. Operational check: grant a leadership user access only to the hosted dashboard, confirm they can view prepared metrics without console access to the lake or brokers, and verify row- or role-level sharing matches policy.