
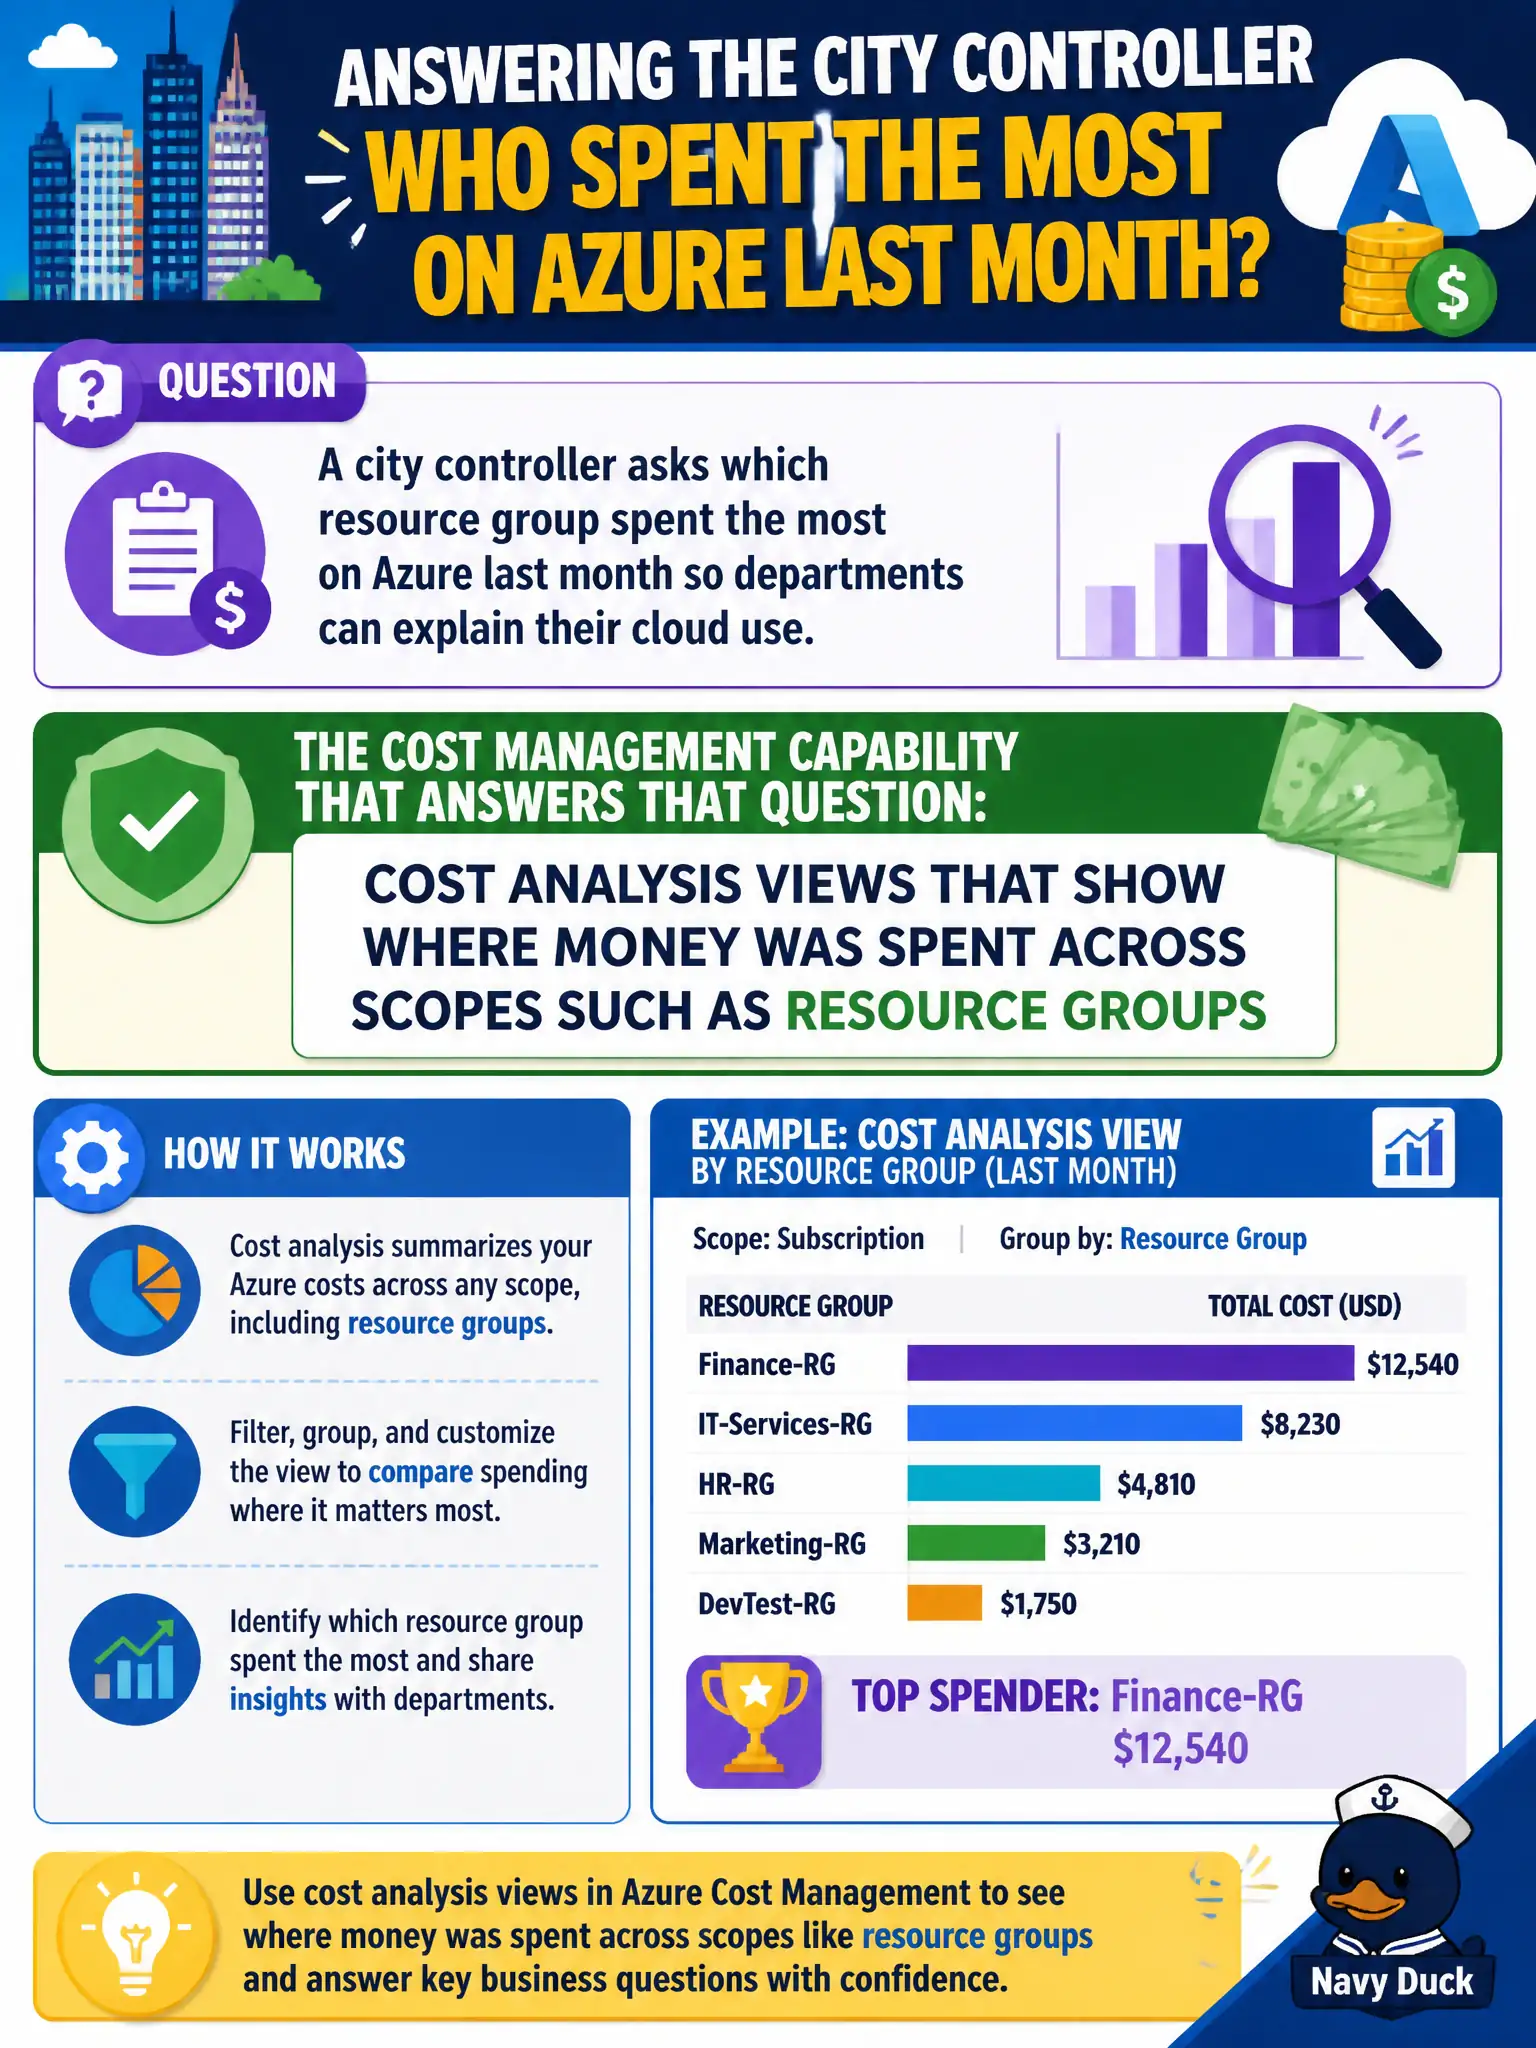
A city controller asks which resource group spent the most on Azure last month so departments can explain their cloud use. Which Cost Management capability answers that question?
Select an answer to reveal the explanation.
Short Explanation
Cost analysis is the "where did the money go?" map. Slice by resource group and last month jumps out for the big spenders. Controllers love that visibility when departments need to explain their cloud use.
Full Explanation
Cost analysis views in Azure Cost Management show where money was spent across scopes such as resource groups, services, meters, and other dimensions. A city controller asking which resource group spent the most last month needs those analysis and reporting views to rank departmental cloud usage and explain variances to finance. That organizational visibility is the Cost Management theme behind monthly reviews and chargeback conversations in municipal IT. Without cost analysis, "who spent what" remains anecdotal rather than evidence-based.
Azure Advisor does not exist only to list unused public DNS zones; Advisor provides broader recommendations and is not the primary ranked spend report by resource group. Cloud Shell history files are not the official invoice store for the city. Resource locks prevent accidental changes or deletions; they do not display ranked departmental spend automatically or substitute for cost analysis.
Exam caveat: "most spent" depends on filter choices—time range, actual versus amortized cost, and currency view—so mis-set filters can mislead council reports even when the tool is correct. Operational check: in cost analysis, set last month's dates, group by resource group, sort by cost, export or capture the ranking for the controller, and spot-check the top group's resources to confirm the spend story matches known civic workloads.