
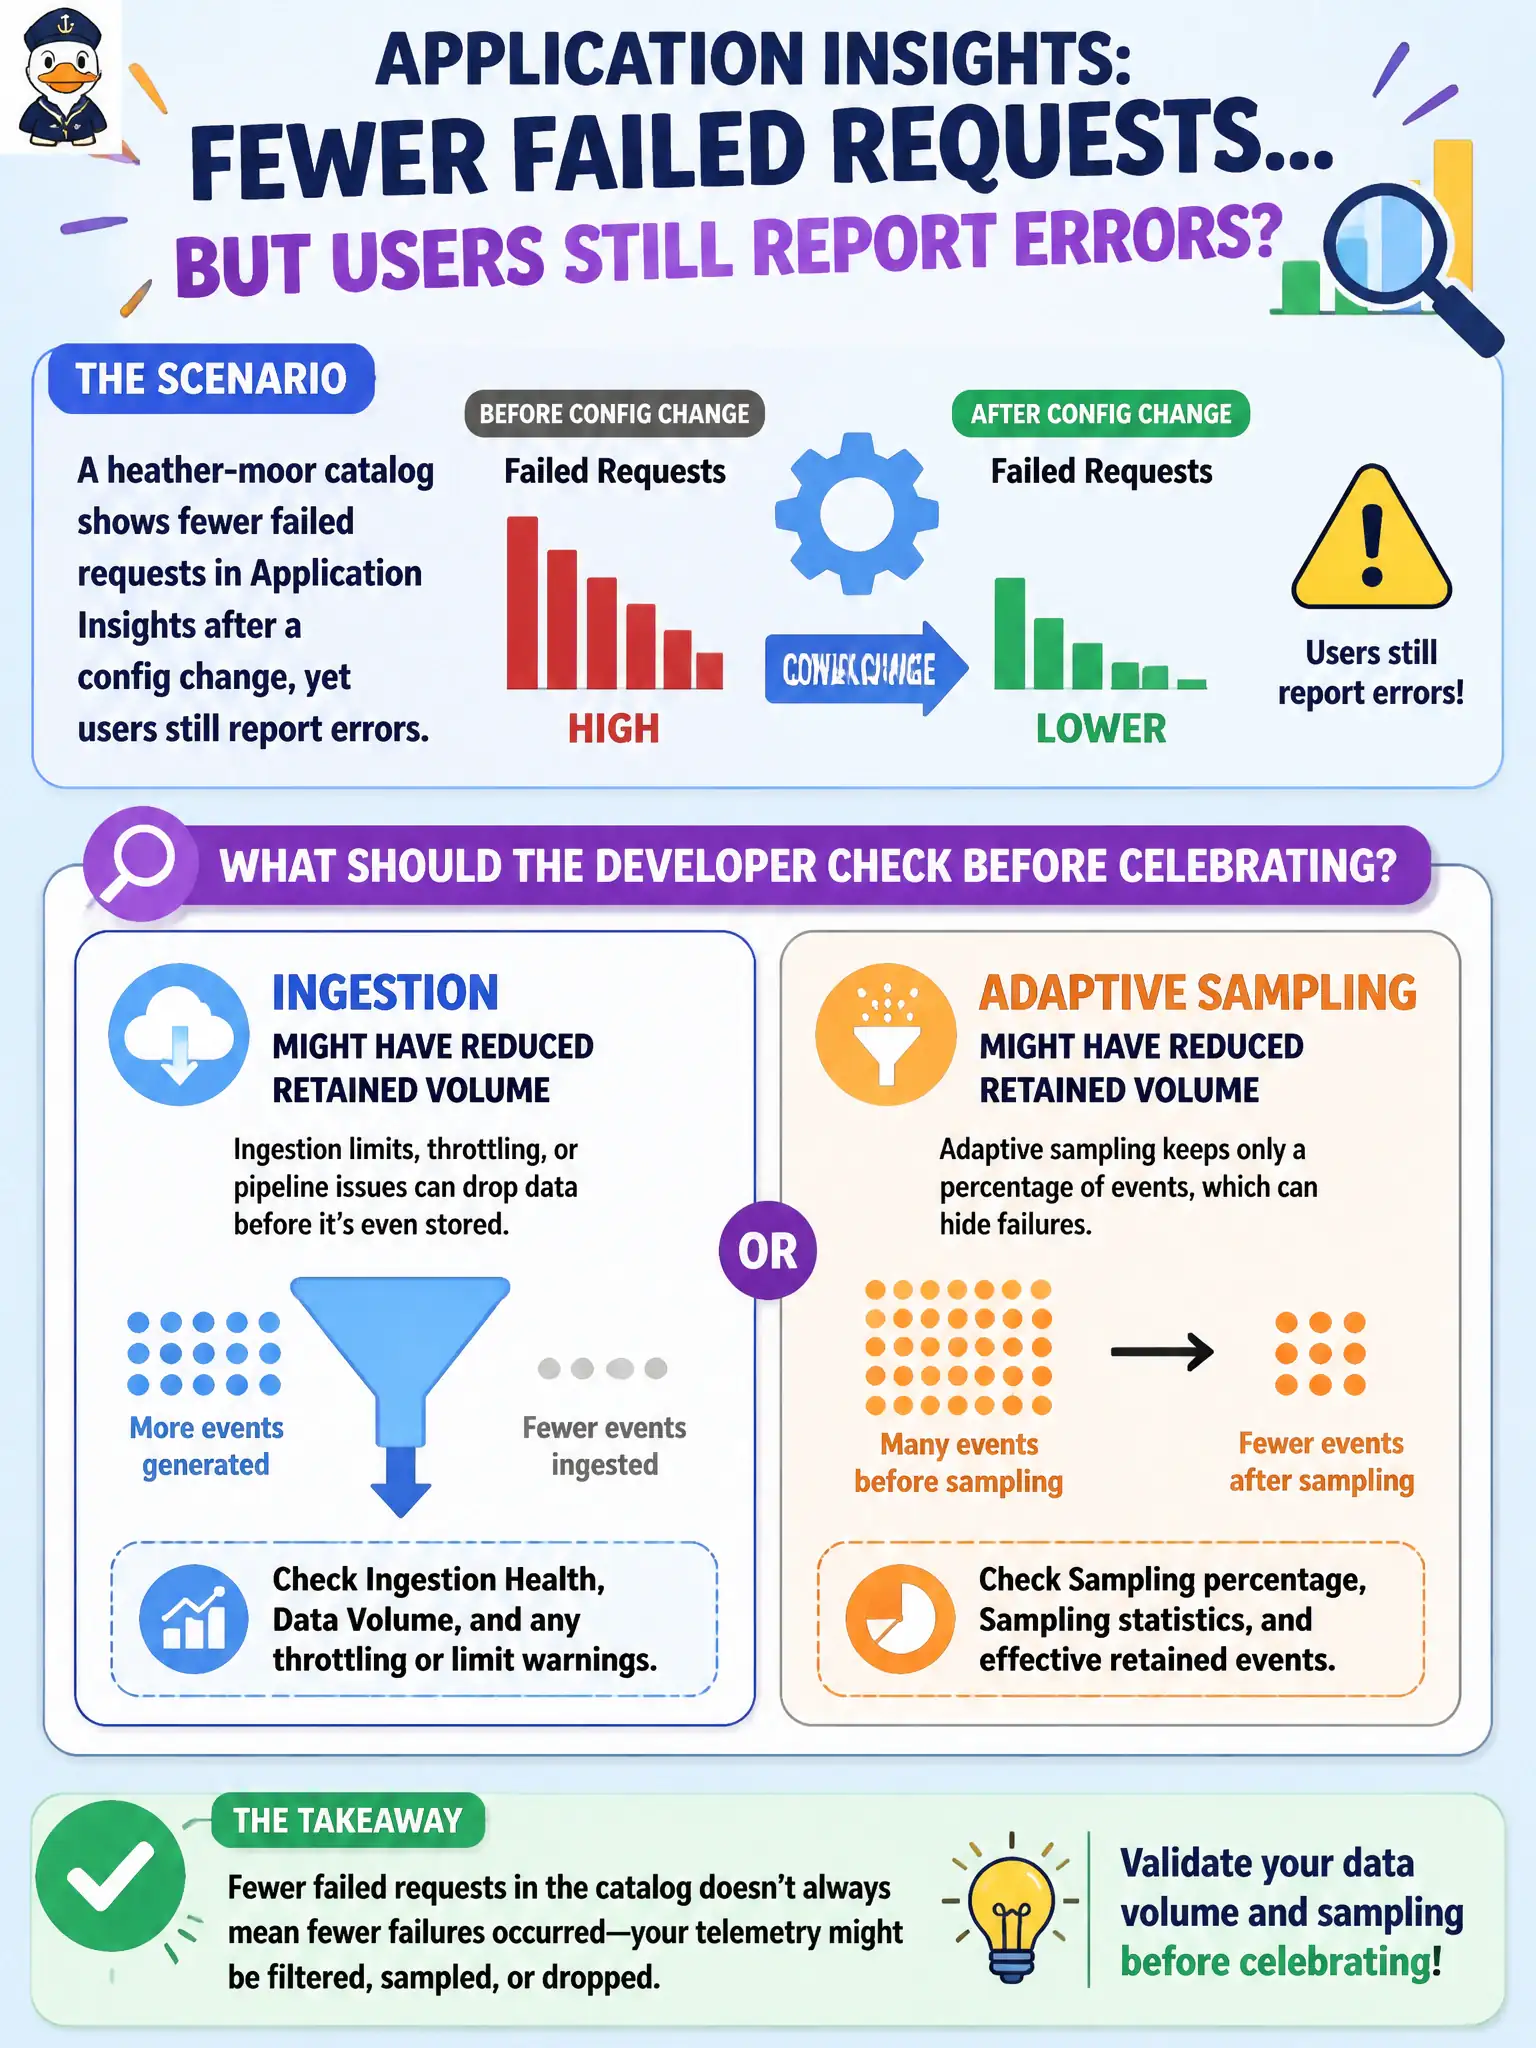
A heather-moor catalog shows fewer failed requests in Application Insights after a config change, yet users still report errors. What should the developer check before celebrating?
Select an answer to reveal the explanation.
Short Explanation
Sampling thins what Insights keeps—it is not a health certificate. Check the sampling rate before high-fiving a quieter Failures blade.
Full Explanation
Application Insights sampling—including adaptive and ingestion sampling—reduces how much telemetry is retained. For the heather-moor catalog that suddenly shows fewer failed requests after a config change while users still report errors, the developer must check whether sampling lowered retained volume before celebrating a health win. Fewer stored failures can mean thinner sampling, not fewer real failures.
Azure Cache for Redis hit ratio alone explaining the drop fails because cache efficiency does not control Application Insights failure ingestion counts. Redis metrics are a different signal family.
Assuming CDN purge completed and that Insights never samples fails on both facts: Application Insights does sample, and CDN purge does not dictate Insights failure retention.
App Service autoscale rules deleting failed requests from Insights fails because autoscale changes instance count; it does not scrub failure telemetry from the Insights store as a designed behavior.
Exam caveat: compare failure rate to request volume and inspect the sampling percentage or AdaptiveSamplingTelemetryProcessor settings—absolute failure counts without volume context mislead. Operational check: review the Insights sampling configuration and the _MS.CollectedDataPercentage or equivalent sampling indicators, then validate with a known forced failure that still appears at the expected rate.