
A granite-ledge worker writes ILogger warnings that never appear on a metric chart. Where should the developer query those messages in Application Insights?
Select an answer to reveal the explanation.
Short Explanation
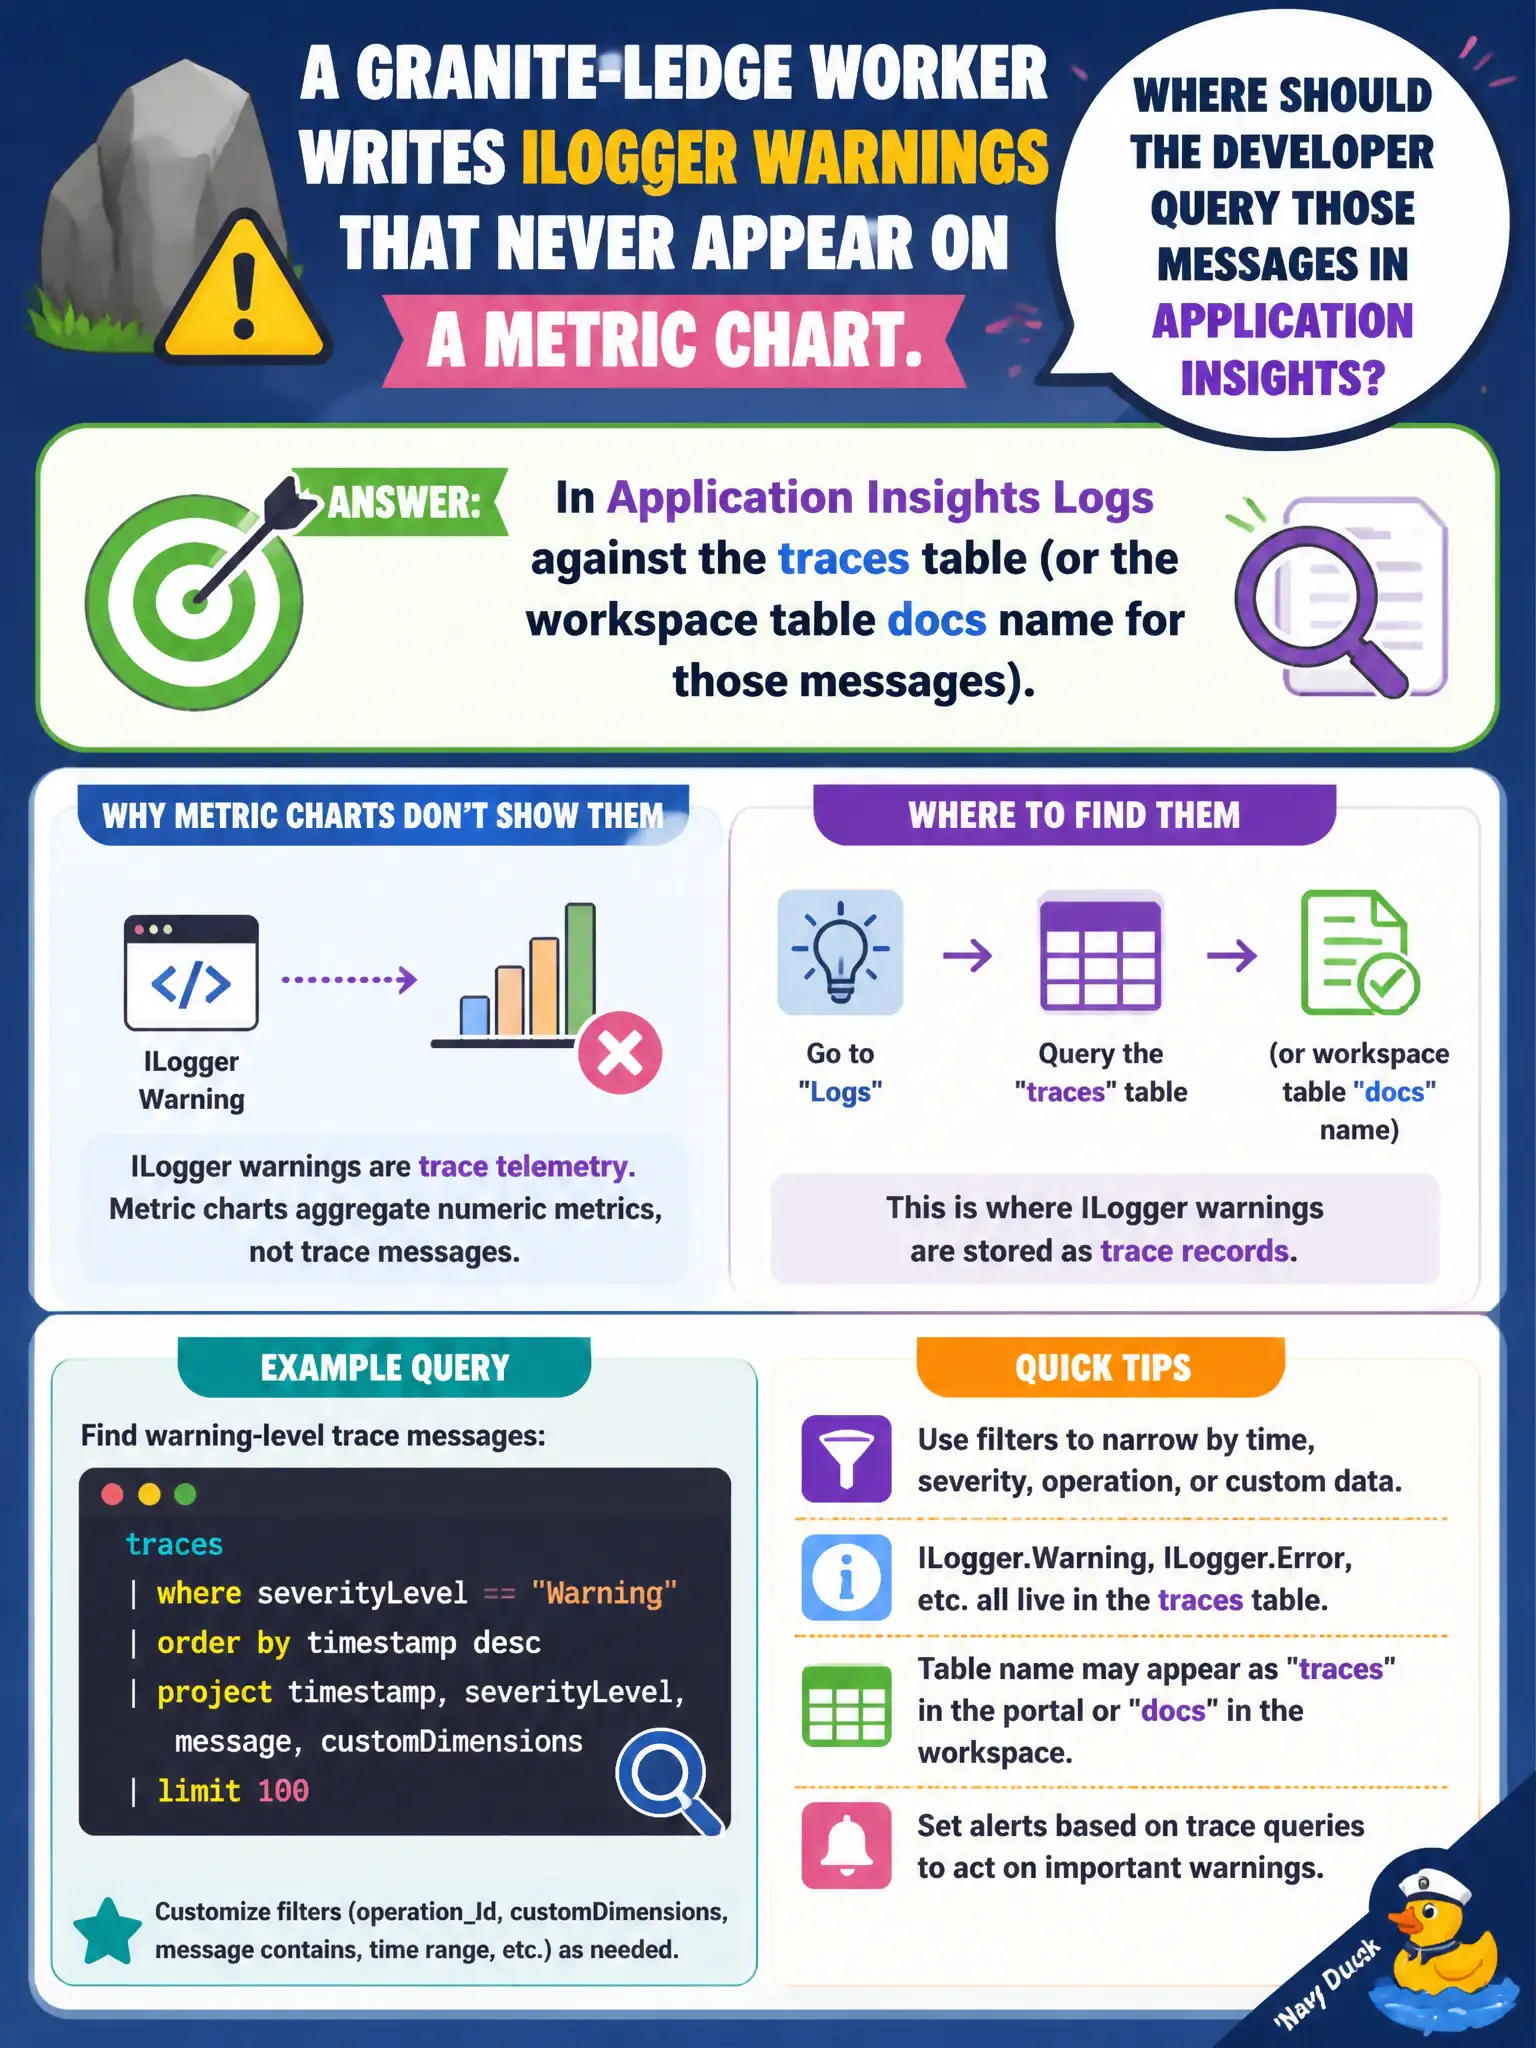
ILogger warnings land in traces (queryable log records), not as metric tiles. Redis keys and Graph audit are the wrong filing cabinets.
Full Explanation
ILogger (and similar) diagnostic messages land as queryable log records in Application Insights, typically the traces table or the Log Analytics table name docs use for those messages. For the granite-ledge worker whose warnings never appear on a metric chart, the developer should open Application Insights Logs and query traces (filtered by severity, message, or cloud_RoleName)—not expect free-form warning text to show up as a numeric metric tile.
Mirroring each warning string as a custom metric name fails because metrics are numeric time series. Turning every distinct warning into a metric name creates cardinality chaos and still does not give searchable message text the way traces do.
Storing messages only in Azure Cache for Redis keys named after each log line fails because Redis is a cache, not the Application Insights log store. Keys expire and are not the Domain 4 query surface for ILogger output.
Microsoft Graph audit logs for every ILogger call fail because Graph audit covers directory and Microsoft 365 activity, not application diagnostic logging routed through Application Insights.
Exam caveat: ensure the logging provider is wired to Application Insights (or OpenTelemetry logs export); otherwise ILogger output never reaches traces even when metrics look healthy. Operational check: emit a distinctive warning, wait for ingestion, and run a Logs query on traces containing that text to confirm the row appears.