
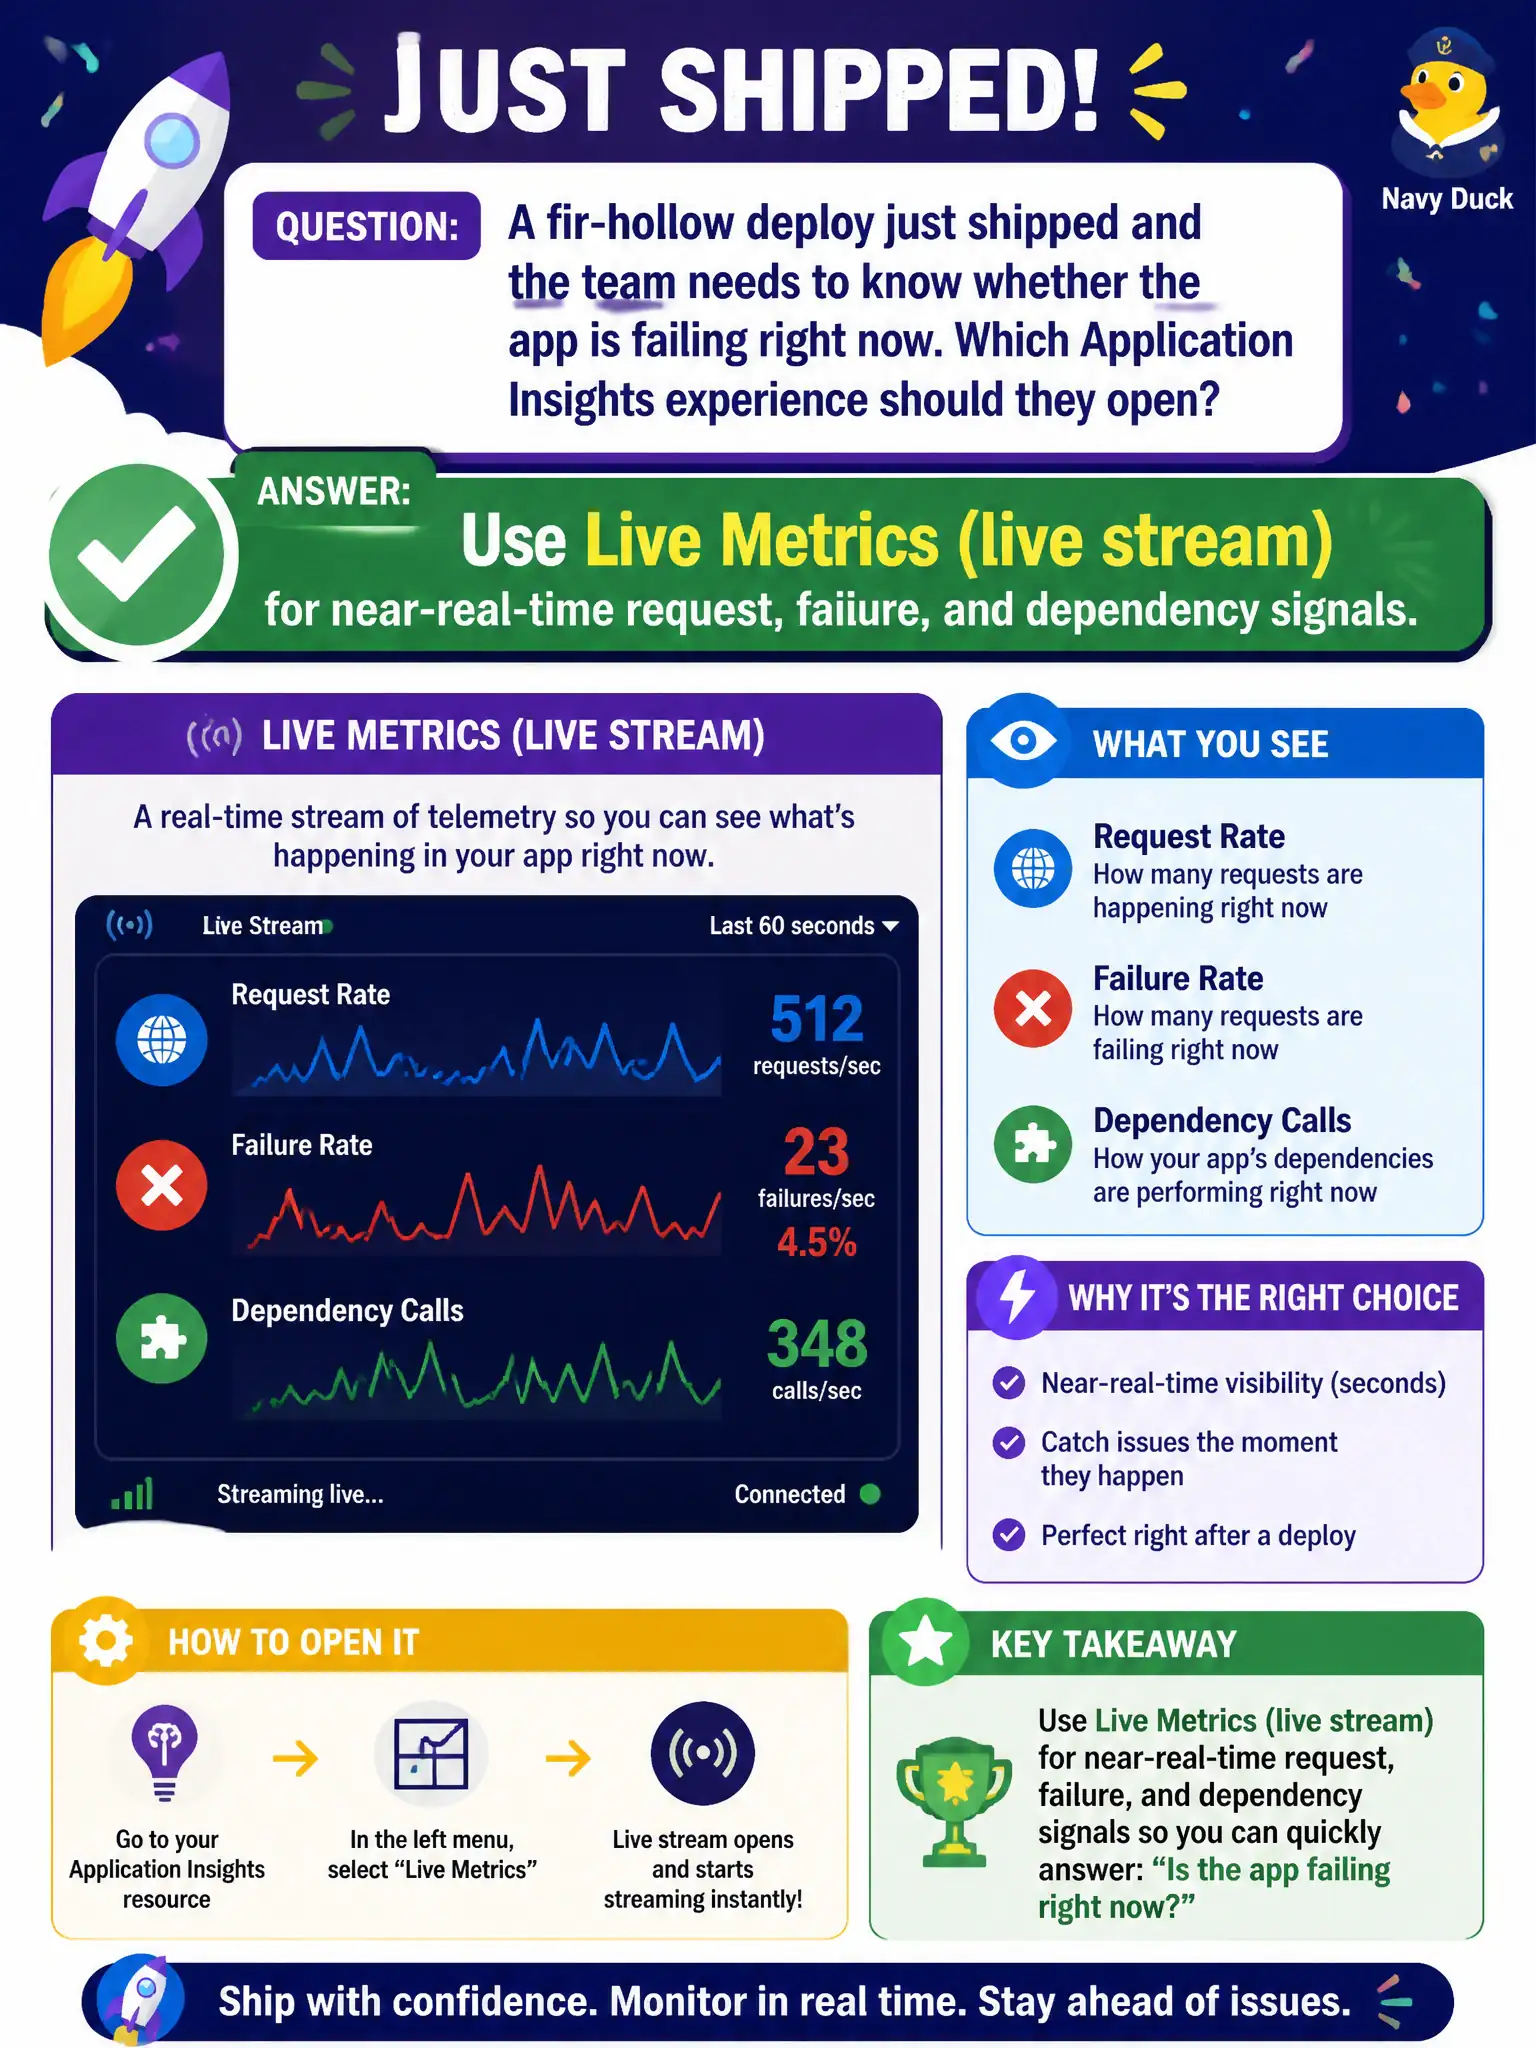
A fir-hollow deploy just shipped and the team needs to know whether the app is failing right now. Which Application Insights experience should they open?
Select an answer to reveal the explanation.
Short Explanation
Live Metrics is the firehose for “is it on fire now.” Stored logs and charts catch up later; release gates alone do not stream request health.
Full Explanation
Live Metrics (live stream) is the near-real-time Application Insights experience for post-deploy health. After the fir-hollow deploy, the team should open Live Metrics to watch request rate, failures, and dependency calls as they happen, rather than waiting for stored analytics to catch up. It answers “is it on fire now?” during the risky minutes after ship.
Waiting overnight for a Kusto retention job fails because Live Metrics is designed for immediate operational signal. Deferred log processing cannot replace the live stream when the question is current failure rate.
Using only an AZ-400 release gate checklist with no Insights stream fails because gates prove pipeline steps completed; they do not stream live request, failure, and dependency telemetry from the running app.
Disabling instrumentation so Live Metrics cannot show noisy post-deploy data fails because silencing telemetry removes the very signals needed to detect a bad deploy. Noise is managed with filters and sampling, not by turning the lights off.
Exam caveat: Live Metrics is for interactive watching and is not a substitute for stored metrics, logs, and alerts once the deploy window closes—pair live watching with lasting alerts. Operational check: during a canary or slot swap, open Live Metrics, generate a few requests, and confirm counters move within seconds before declaring the deploy healthy.