
An eelgrass-bay ranger reports one checkout that hung at 14:03. How should the developer locate that single operation in Application Insights?
Select an answer to reveal the explanation.
Short Explanation
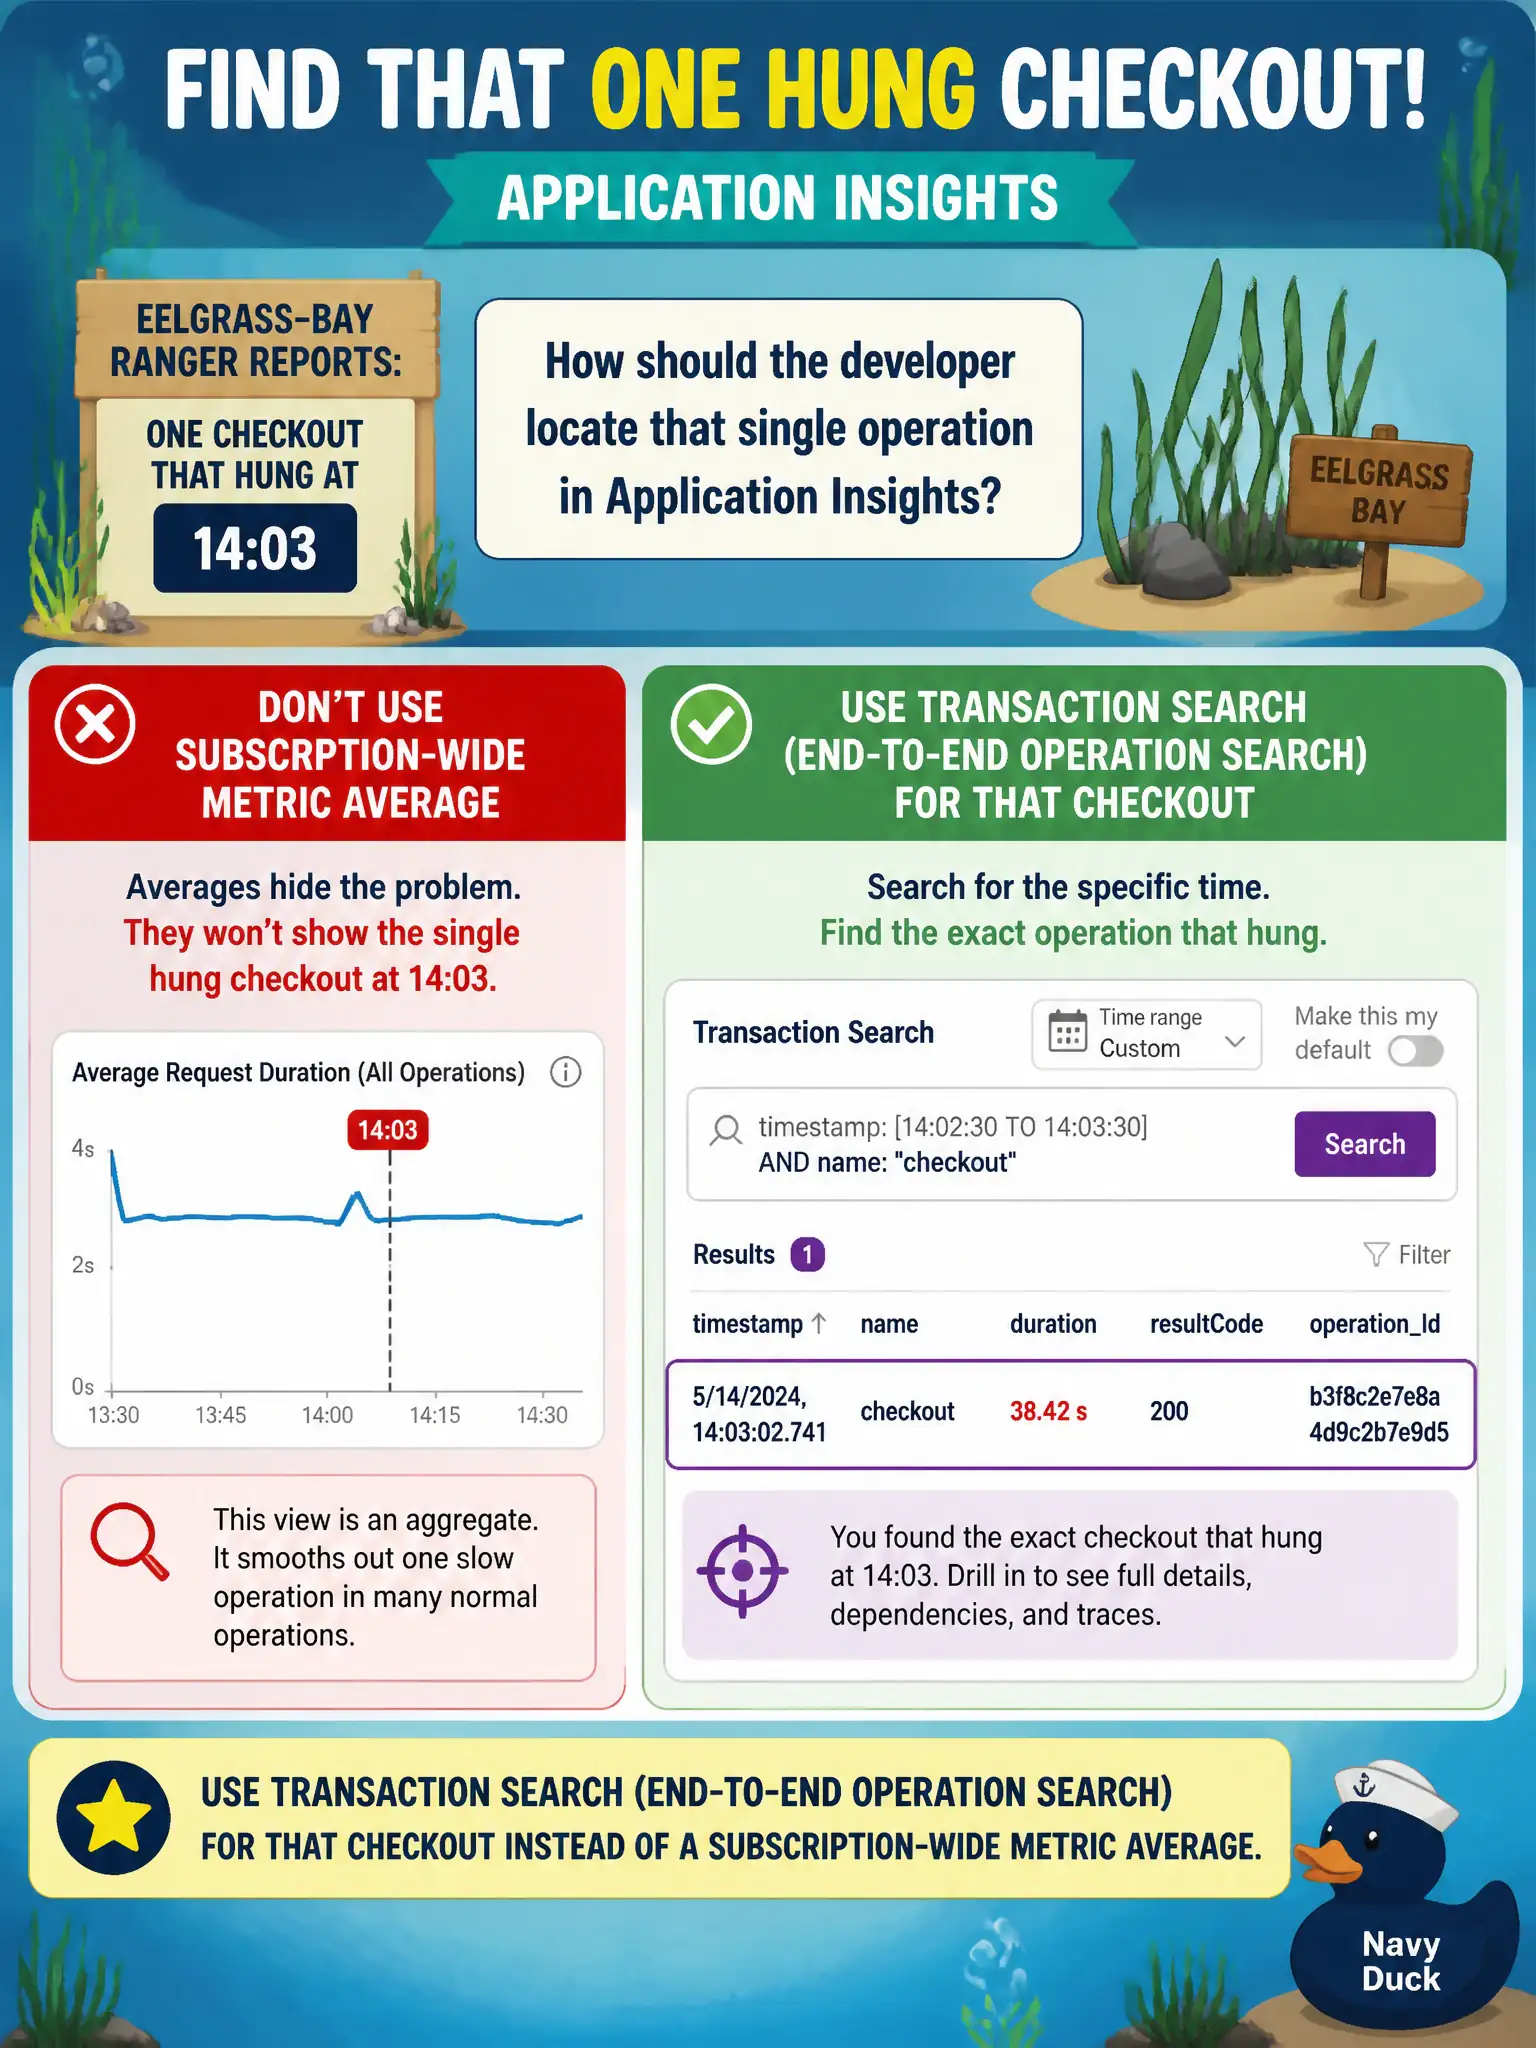
One hung checkout needs transaction/search—find that operation id and walk its timeline. A month-long average chart will never name the 14:03 victim.
Full Explanation
A single hung checkout at 14:03 is an instance-level investigation. Transaction search (end-to-end operation search) in Application Insights locates that eelgrass-bay ranger’s operation by time, id, or properties and walks the correlated timeline of request, dependencies, and exceptions. Aggregates hide individuals; search surfaces the one call.
Staring only at a 30-day average failure-rate chart fails because averages and long windows dilute or erase a one-off hang. The chart will not name the 14:03 victim or show its dependency tree.
Opening an AZ-400 release dashboard and ignoring Application Insights fails because pipeline dashboards track deployment health and gates, not the end-to-end Application Insights operation for a single checkout.
Purging the Insights resource fails operationally and conceptually: deleting telemetry destroys evidence and guarantees the hung call cannot be found. Investigation requires retention and search, not erasure.
Exam caveat: sampling and retention can omit rare operations—if search finds nothing, widen the time range, check sampling rate, and confirm the operation name or user id used in the query matches what instrumentation emits. Operational check: recreate a checkout near a known time, search by that window or operation id, and verify the timeline shows the hang’s dependency or exception.