
A dune-grass booking site has rising HTTP 500s one week and rising p95 latency the next. Which Application Insights views match those jobs?
Select an answer to reveal the explanation.
Short Explanation
Failures answers “what broke.” Performance answers “what is slow.” Keep Domain 1 Diagnose-and-solve as a side tool, not a Redis/CDN substitute for Insights.
Full Explanation
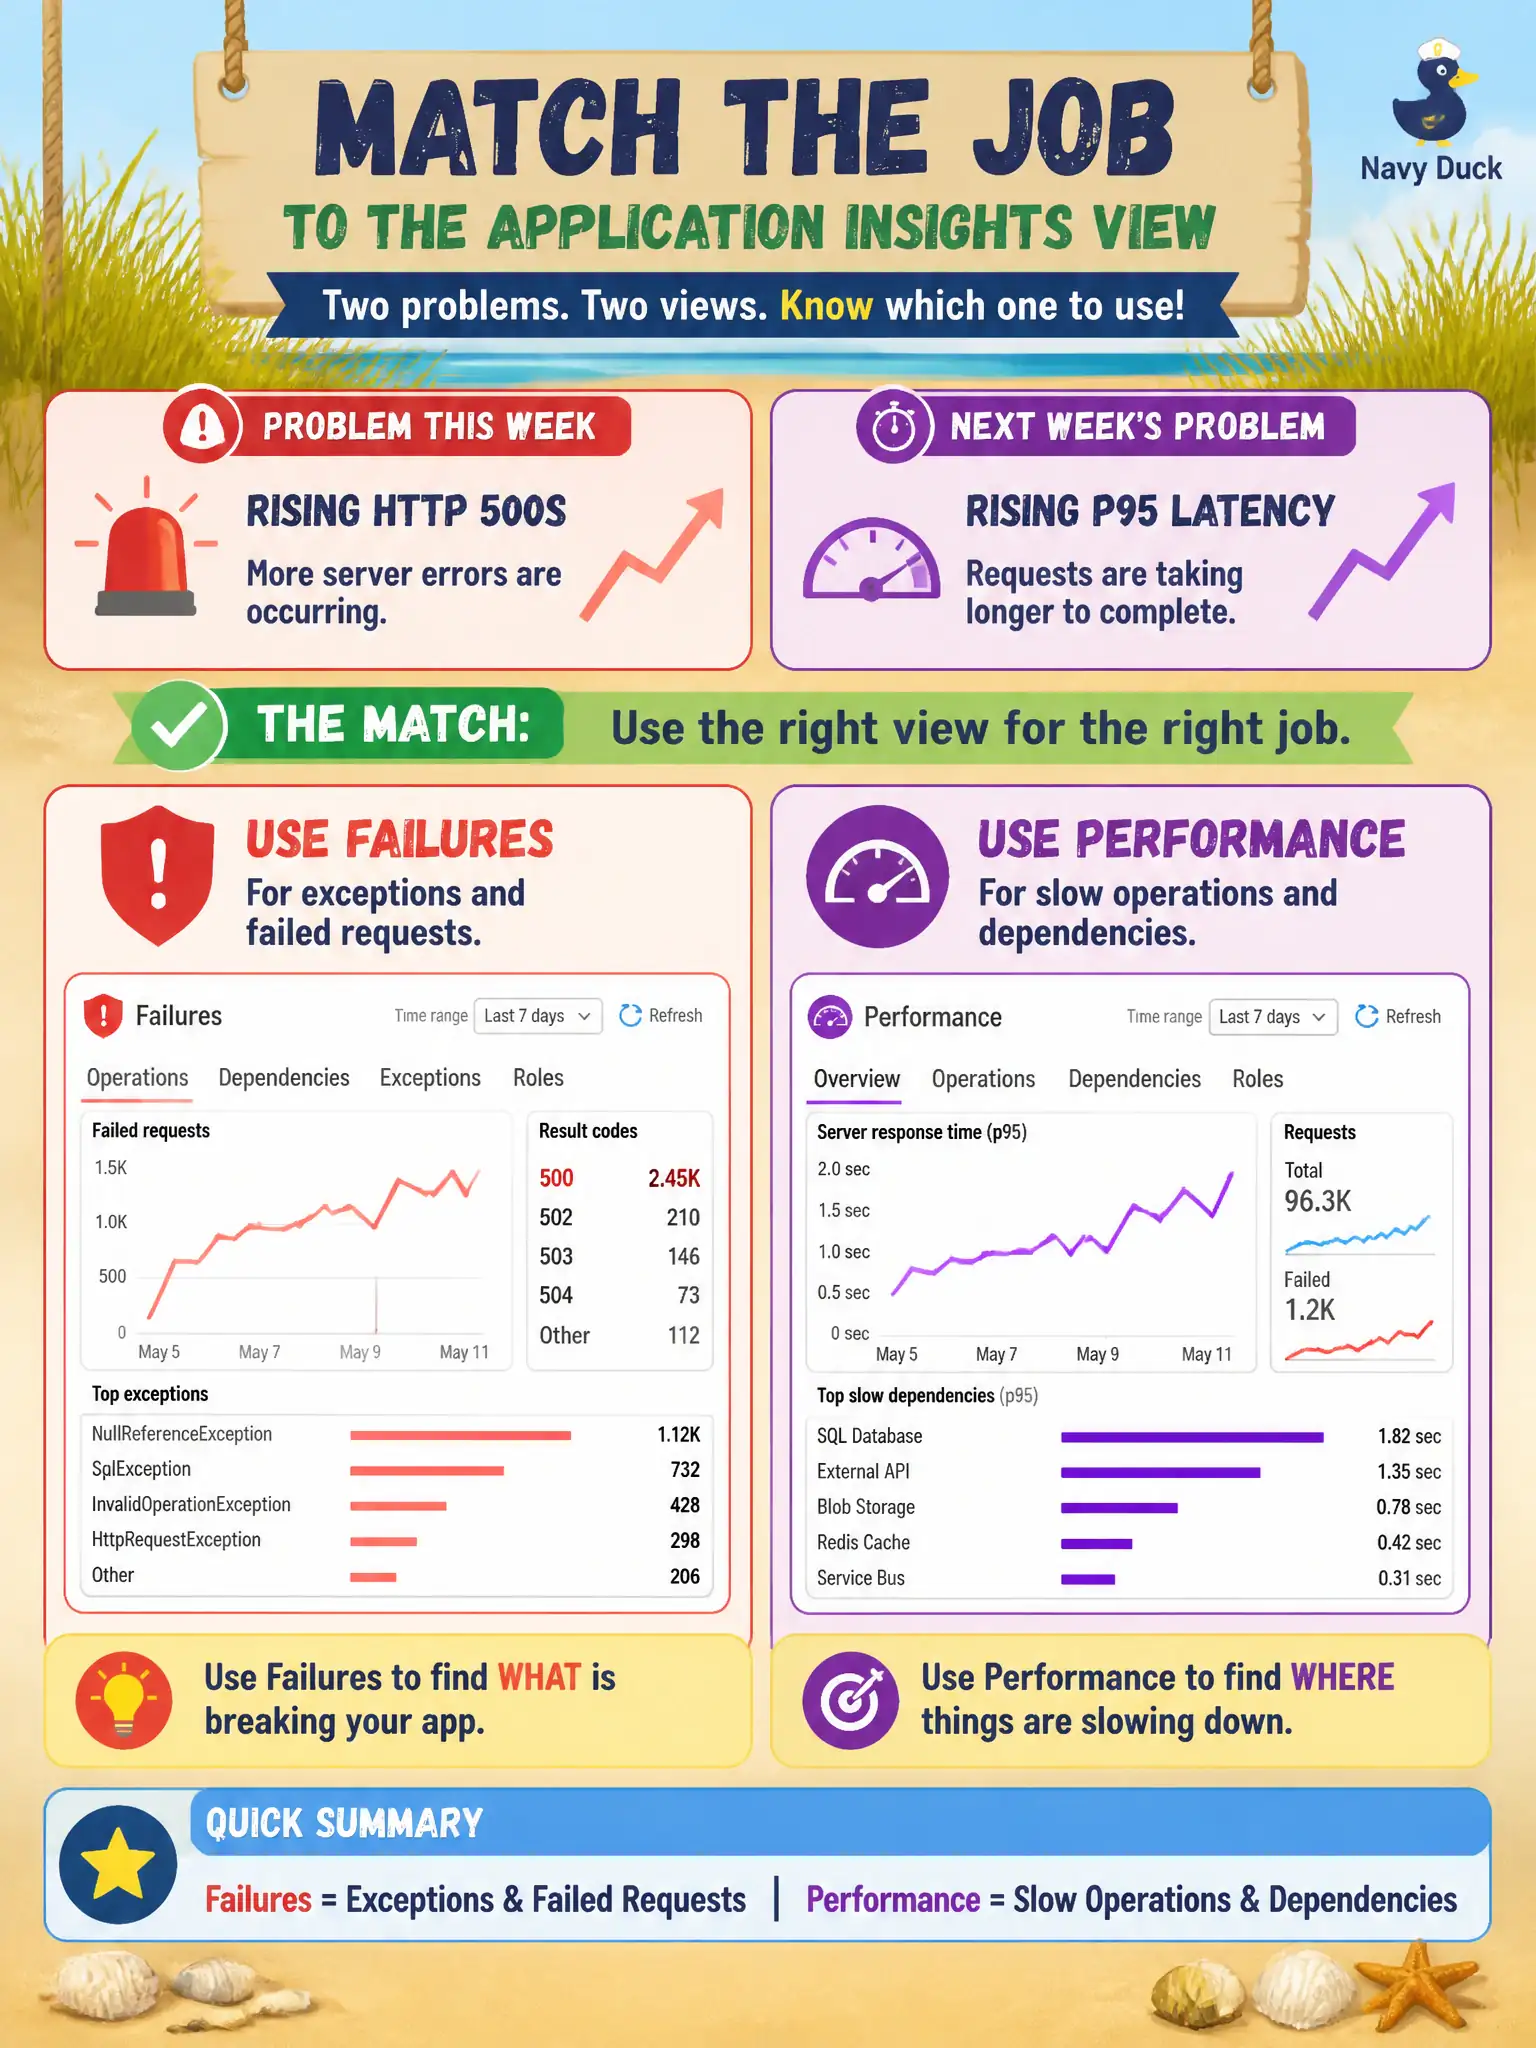
Application Insights separates failure investigation from latency investigation. For the dune-grass booking site, rising HTTP 500s belong in Failures—exceptions and failed requests—while rising p95 latency belongs in Performance—slow operations and dependencies. Matching the symptom to the view keeps the team from hunting exceptions when the problem is duration, or vice versa.
Using App Service Diagnose and solve only, and never opening Insights Failures or Performance, fails because Diagnose and solve is primarily a host/platform diagnostic path (Domain 1–adjacent). It does not replace Application Insights Failures and Performance for application exception and dependency latency analysis on Domain 4.
Using Failures for both exceptions and slow dependencies while ignoring Performance fails the concept split: Failures emphasize errors; slow-but-successful dependencies are Performance concerns. Stuffing latency work into Failures alone leaves duration investigation incomplete.
Using Redis Cache metrics for 500s and CDN purge history for p95 fails because neither surface is the Application Insights Failures/Performance pair. Redis and CDN operations answer cache and edge questions, not Insights exception and operation duration analysis.
Exam caveat: a spike can show both failures and latency—open Failures first for 500s, then Performance for p95, and correlate by time window rather than assuming one blade explains both. Operational check: reproduce a 500 and a slow dependency, confirm the 500 appears under Failures and the slow call under Performance with matching timestamps.