
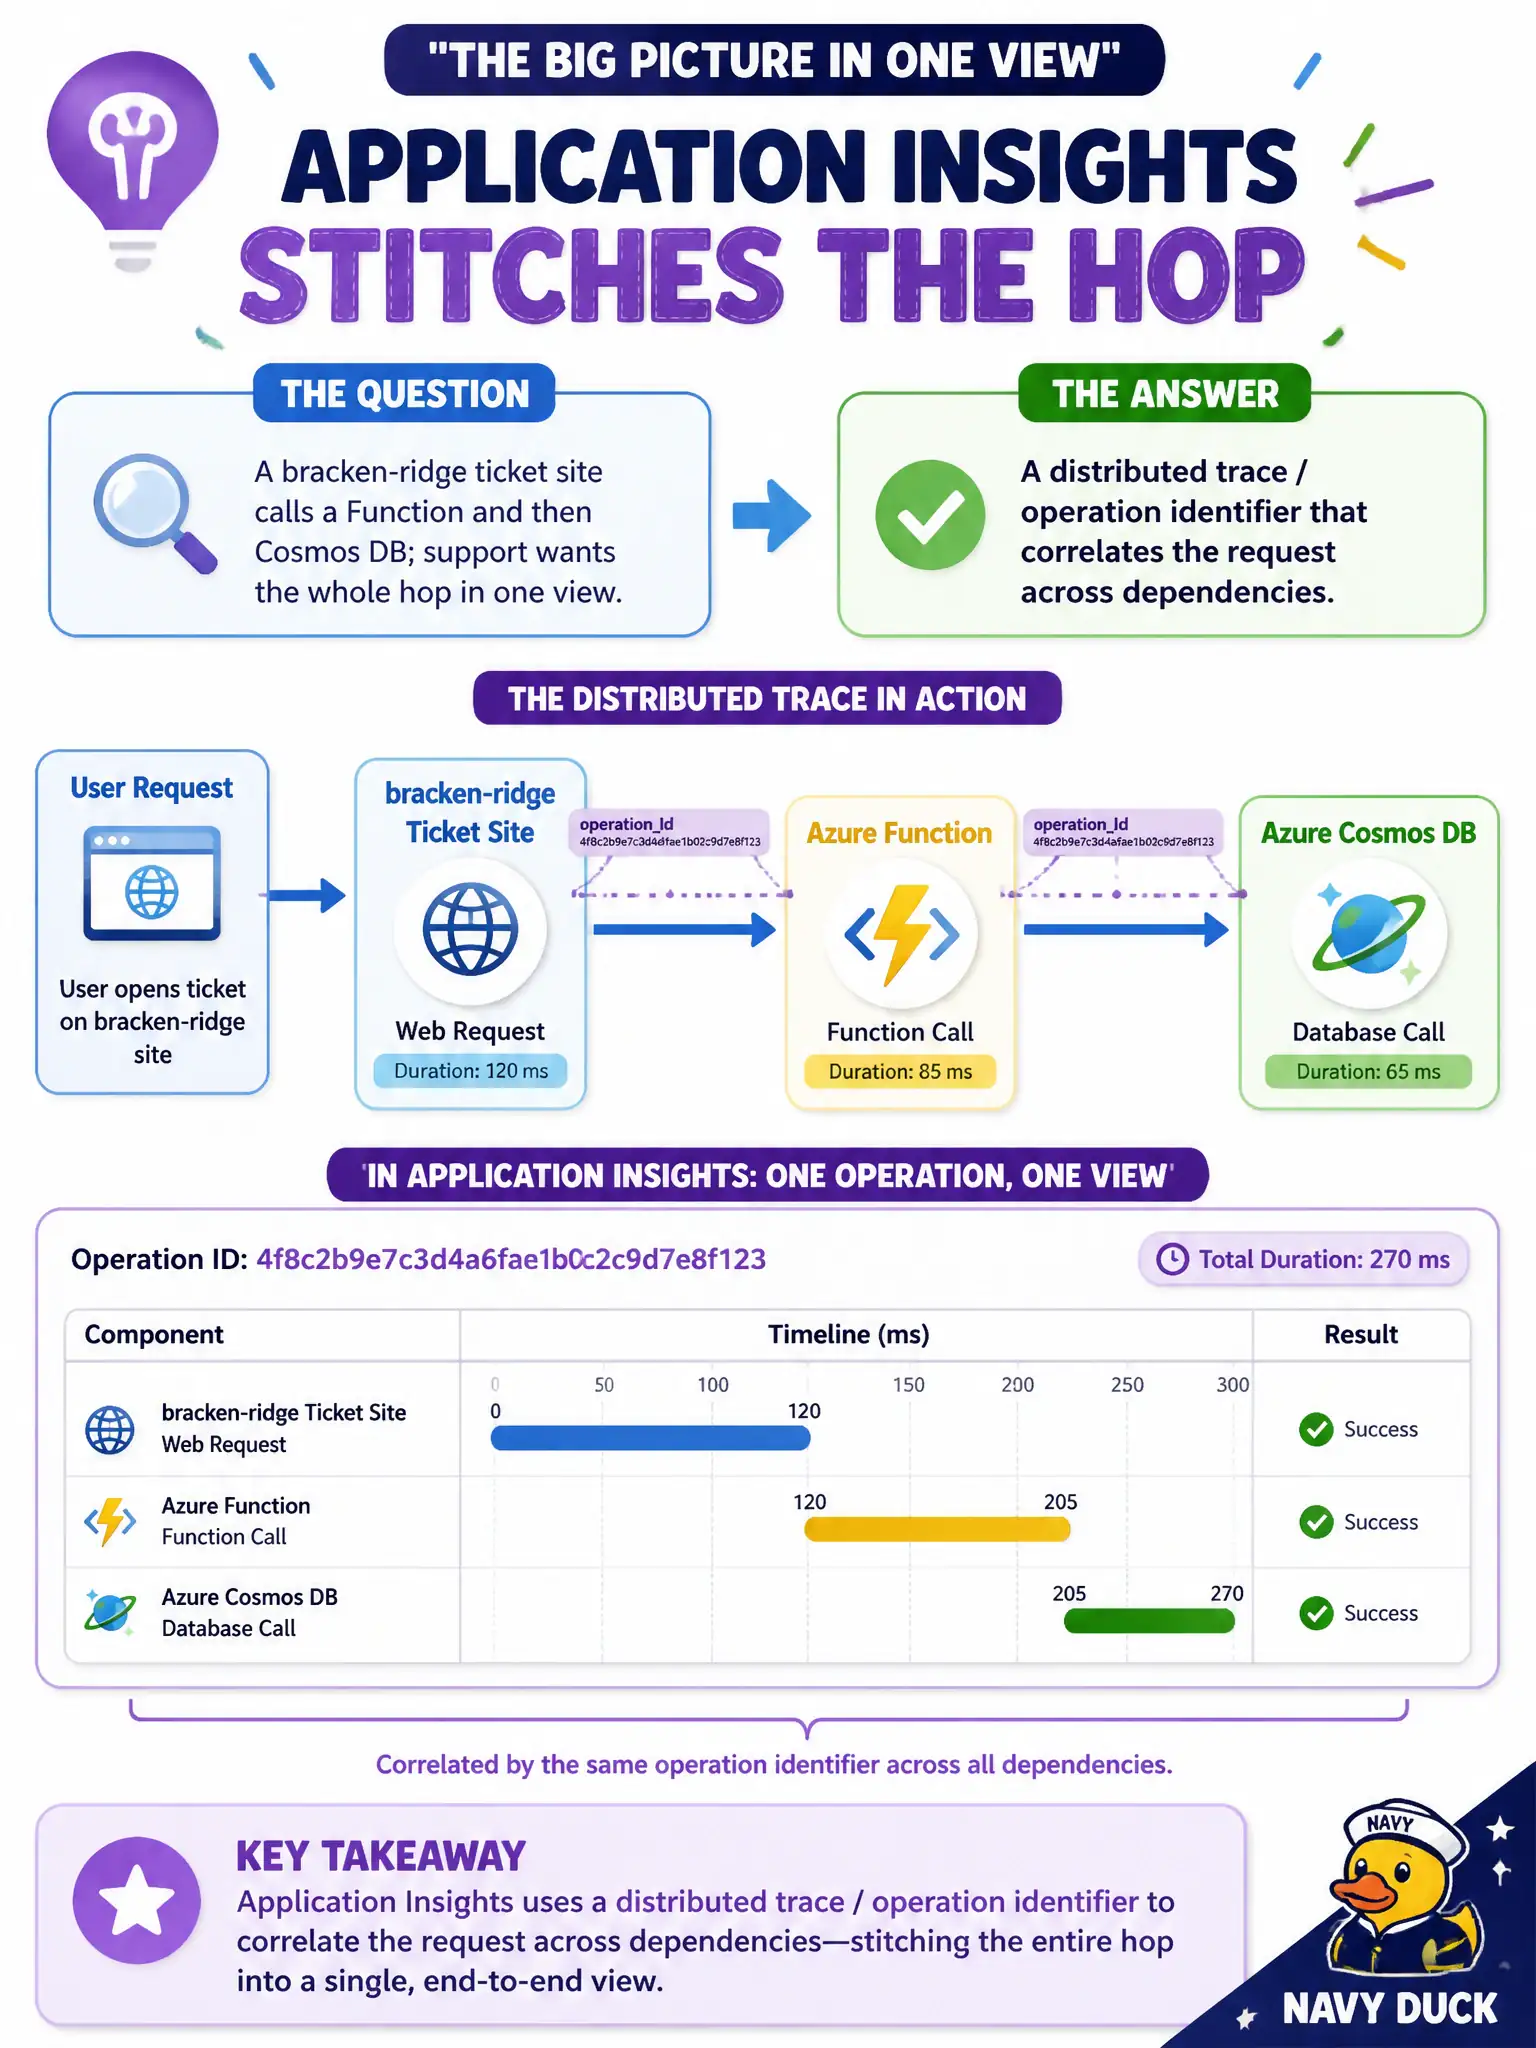
A bracken-ridge ticket site calls a Function and then Cosmos DB; support wants the whole hop in one view. What Application Insights feature stitches that operation?
Select an answer to reveal the explanation.
Short Explanation
Distributed traces glue the web call, Function hop, and Cosmos dependency under one operation id. One lonely log line, Event Hubs Capture, and Graph are different tools.
Full Explanation
Application Insights stitches multi-hop work with a distributed operation (trace) identifier. For the bracken-ridge ticket site that calls a Function and then Cosmos DB, that correlation id links the incoming request to dependency calls so support can open one end-to-end operation view instead of guessing which Function invocation belongs to which Cosmos read. Instrumentation propagates the context across hops so the whole path appears together.
A single uncorrelated log line fails because without an operation identifier there is no join key across services. One warning in isolation does not reconstruct the ticket site → Function → Cosmos path support needs.
Event Hubs Capture as the only correlation store fails because Capture persists event streams to storage for analytics or replay; it is not the Application Insights distributed-tracing mechanism that correlates requests and dependencies in the Insights UX.
Microsoft Graph change notifications for every Cosmos read fail because Graph notifications track directory or Microsoft 365 resource changes, not Cosmos DB dependency telemetry inside Application Insights. They do not produce the Domain 4 end-to-end operation view.
Exam caveat: correlation requires consistent instrumentation and context propagation on each hop—missing headers or uninstrumented services create broken traces even when each tier logs locally. Operational check: trigger one ticket purchase, open the end-to-end transaction for that operation id, and verify the Function dependency and Cosmos dependency appear under the same root request.