
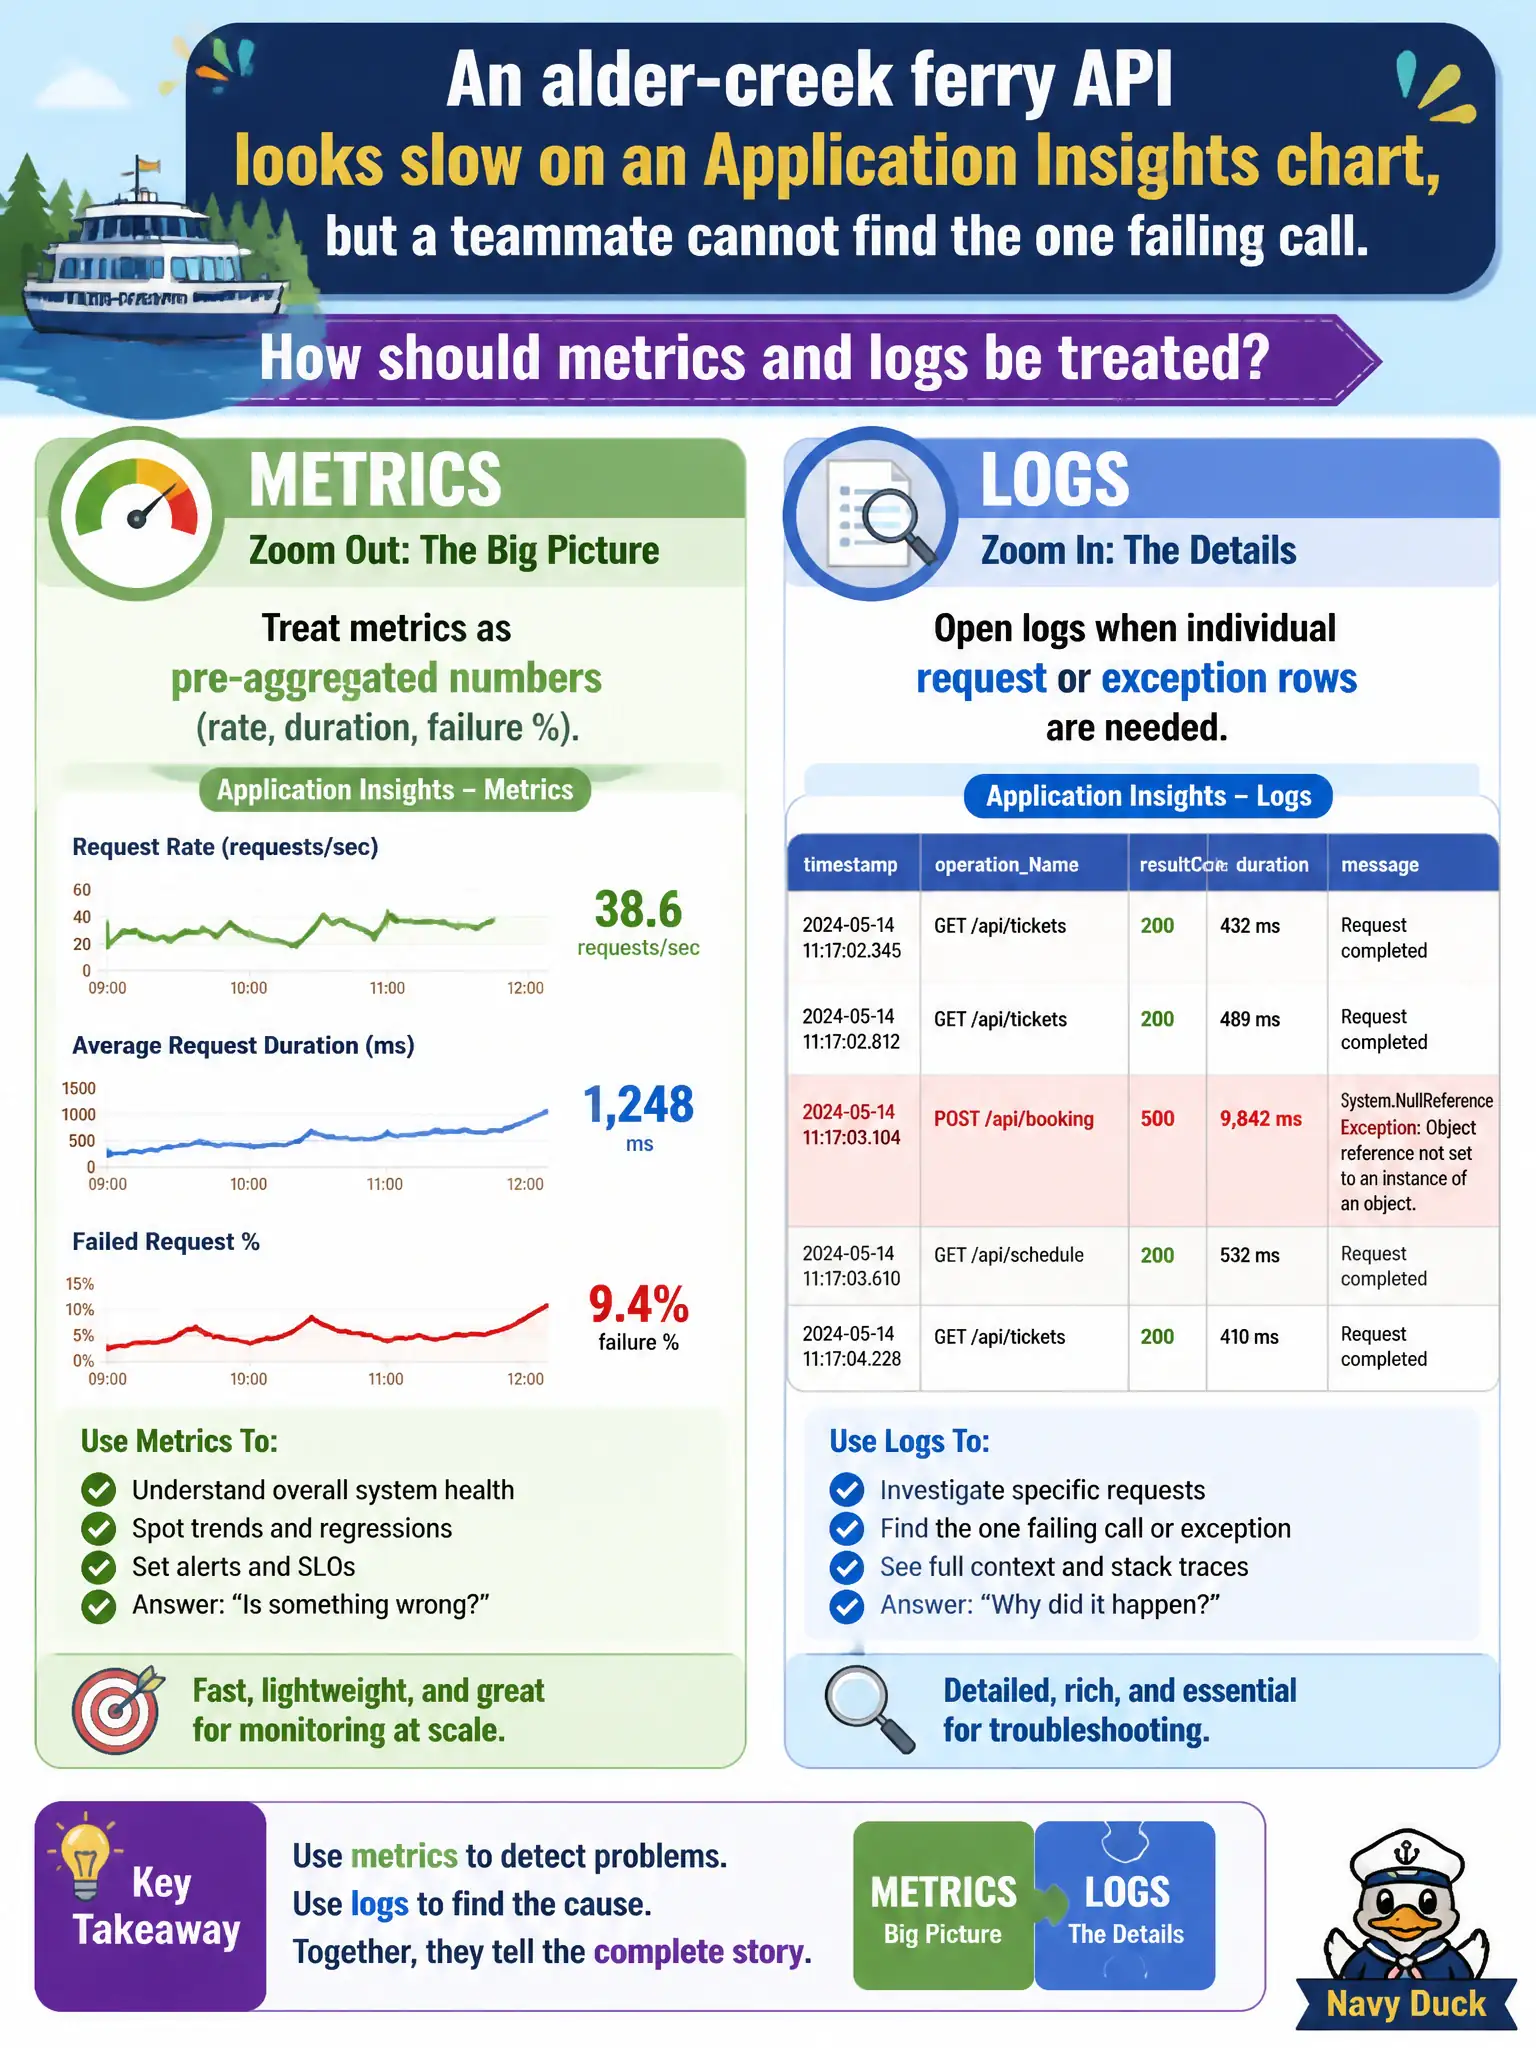
An alder-creek ferry API looks slow on an Application Insights chart, but a teammate cannot find the one failing call. How should metrics and logs be treated?
Select an answer to reveal the explanation.
Short Explanation
Metrics are rolled-up scores—great for trends, terrible for one bad checkout. Logs (and traces) hold the individual rows. Redis “optimize” charts are not Domain 4.
Full Explanation
Application Insights metrics are pre-aggregated numeric series—request rates, durations, failure percentages—built for trend detection, not for reconstructing one bad checkout. When the alder-creek ferry API looks slow on a chart but a teammate cannot find the failing call, treat metrics as the summary layer and open logs (or transaction/end-to-end search) for individual request, dependency, and exception rows. Metrics answer “is the rate bad?”; logs answer “which operation failed and why?”
Treating every metric chart as a full request-body archive fails because metrics do not store payloads or per-call detail. Charts collapse many operations into buckets; they cannot replace log queries when a single request must be identified.
Replacing Application Insights with Azure Cache for Redis hit-rate graphs fails because Redis metrics describe cache efficiency, not end-to-end API request and exception telemetry. Cache hit ratio will not surface the ferry API’s failing dependency chain.
Treating Log Analytics workspace administration as the only AZ-204 skill and ignoring app telemetry fails because Domain 4 expects developers to use Application Insights application telemetry—metrics, logs, traces—not only workspace RBAC and retention administration.
Exam caveat: some investigations need both—use a metric alert or chart to spot the window, then pivot to logs or transaction search inside that window; do not assume one surface replaces the other. Operational check: pick a known failing request id or timestamp from the chart’s spike, query requests/exceptions/dependencies for that time range, and confirm the individual row appears where the aggregate only showed a percentage.