
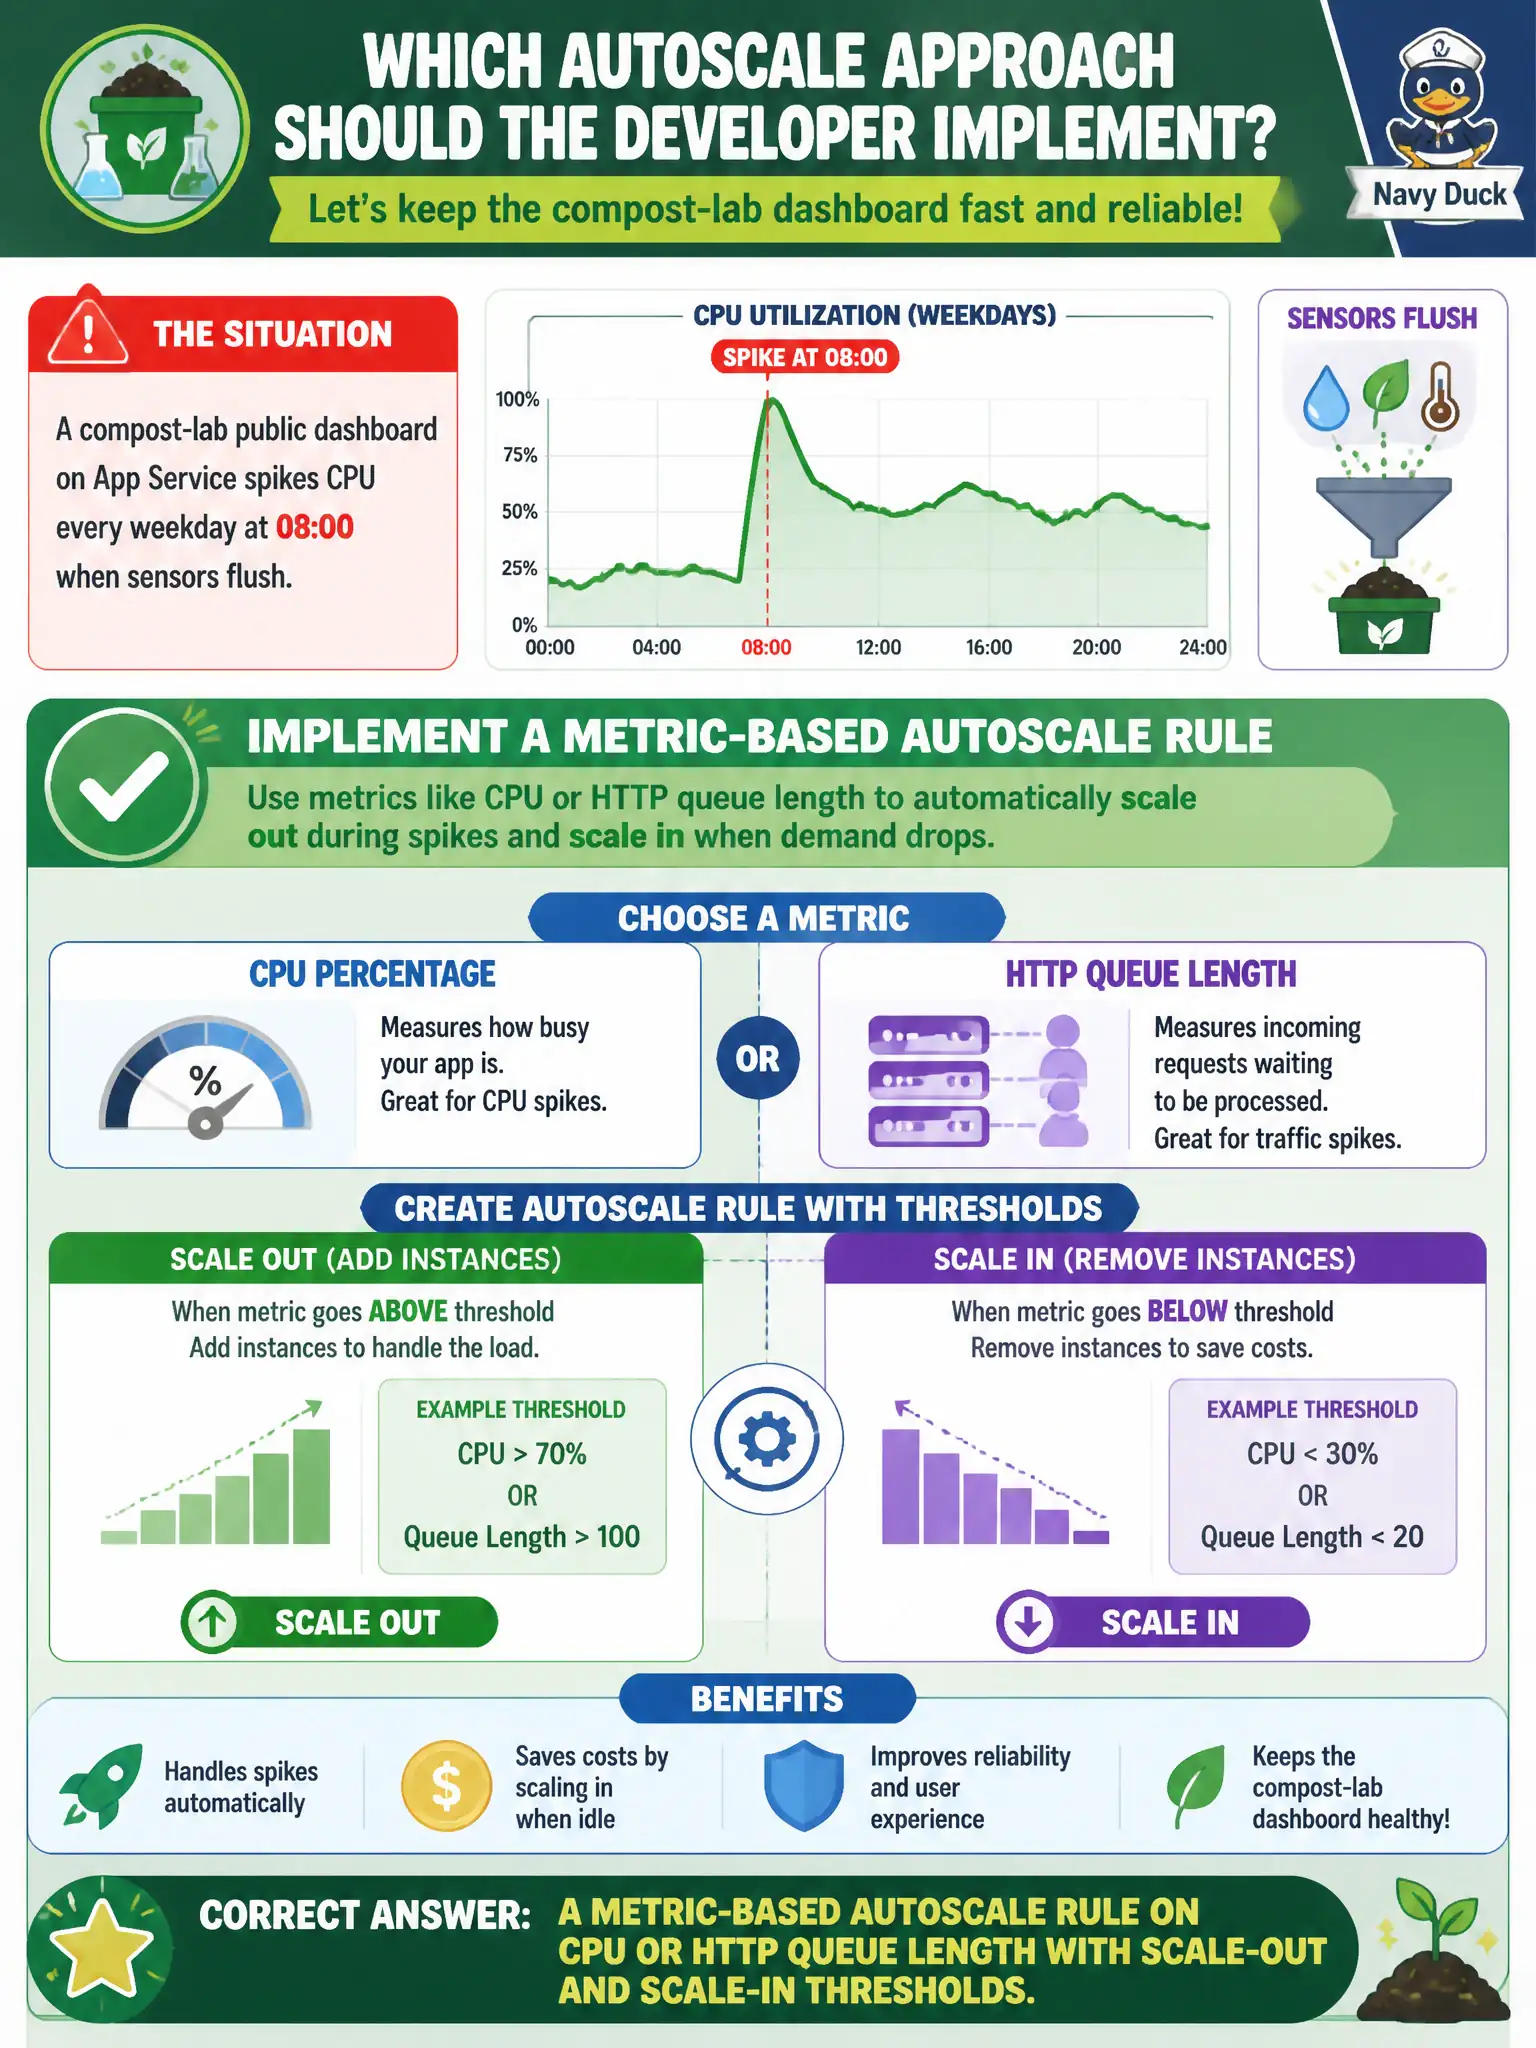
A compost-lab public dashboard on App Service spikes CPU every weekday at 08:00 when sensors flush. Which autoscale approach should the developer implement?
Select an answer to reveal the explanation.
Short Explanation
When the sensors all shout at once, CPU climbs—so teach the plan to add instances when that metric crosses a line, then shed them when it cools. That is App Service metric autoscale, not an Application Insights ping or a Cosmos RU dial.
Full Explanation
The compost-lab public dashboard spikes CPU every weekday at 08:00 when sensors flush, so the plan needs automatic horizontal reaction to that load. Implement metric-based autoscale on the App Service plan: watch CPU percentage or HTTP queue length, scale out when the metric crosses a threshold for a sustained window, and scale in when load cools so idle capacity is not left running all day. Metric rules match bursty sensor flushes that may not land at a perfectly predictable second, and they keep instance count aligned with observed demand.
An Application Insights availability test that emails when the home page fails is synthetic monitoring and alerting; it can notify operators but does not add or remove App Service instances. A manual slot swap from staging to production each morning at 07:55 is a release action, not capacity management—swapping code does not increase worker count when CPU climbs. A Cosmos DB autoscale throughput setting on the dashboard’s document collection adjusts request units for Cosmos, not the web app’s compute instances; the dashboard can still saturate on App Service while Cosmos RUs float independently.
Exam caveat: poorly chosen scale-in thresholds cause flapping—use duration/cooldown so the plan does not thrash instance count around the 08:00 spike. Operational check: after publishing the rules, generate or wait for a CPU/queue spike, confirm instance count rises in the plan metrics, then verify scale-in returns toward the minimum once the sensor flush ends.