
A news site's CloudFront cache statistics show a high error rate, and the team needs the per-request HTTP status and error type, including whether the origin caused it. Which source provides that?
Select an answer to reveal the explanation.
Short Explanation
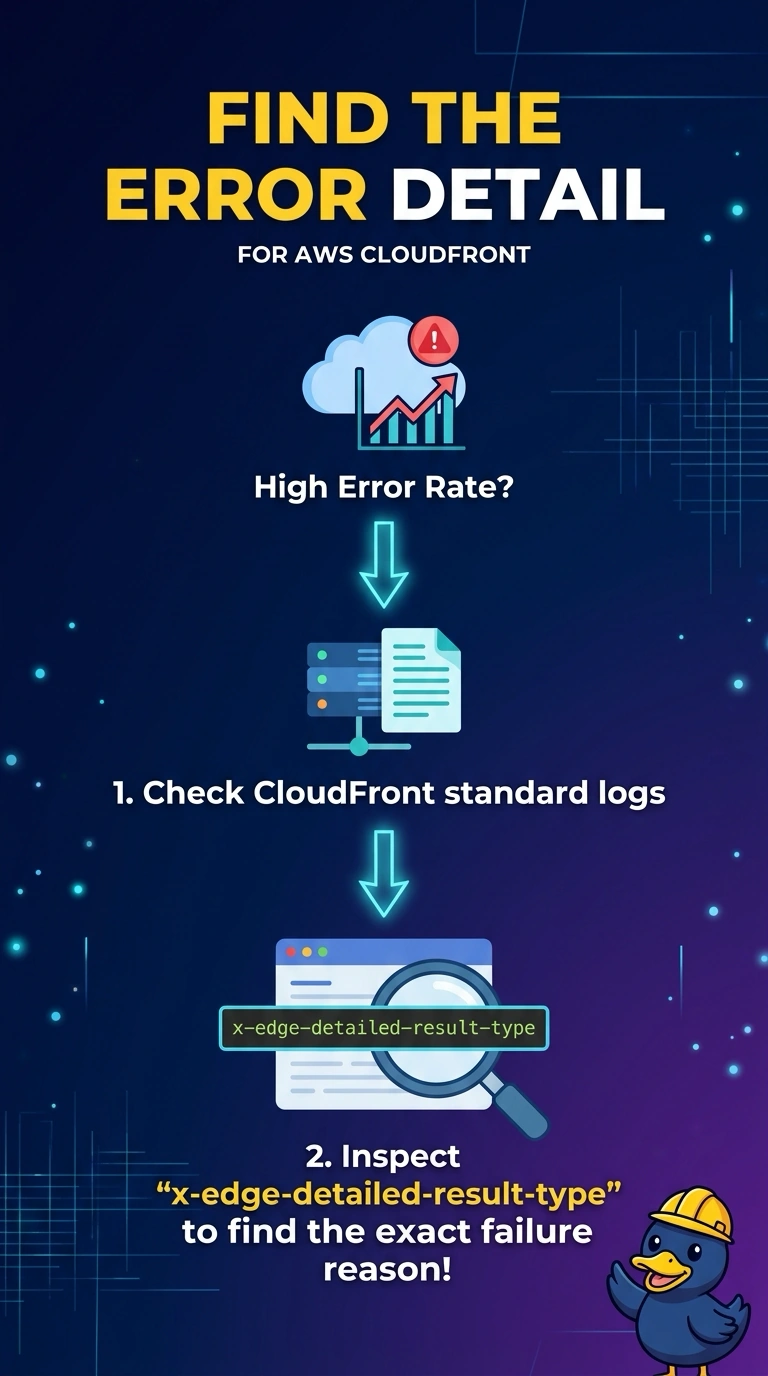
The scoreboard shows how often the team erred, not which pitch missed the plate. You open the CloudFront standard logs to read the status and detailed result type of each request behind that error rate. The cache statistics chart stays a rate, and it does not name the status for each request.
Full Explanation
CloudFront cache statistics summarize how requests were served, including an error rate. They do not list the status or error type of each request, so a high error rate alone does not tell the news site what went wrong. Standard logs, also called access logs, record each request, including sc-status, the status CloudFront returned to the viewer, and x-edge-detailed-result-type, which names the error when the result is Error, for example OriginError, OriginConnectError or OriginCommError. Together they show whether the origin caused the failures. Standard logging (v2) can also add origin first-byte and last-byte latency. CloudTrail data events record data-plane API calls you enable on AWS services. Viewer requests to CloudFront are not CloudTrail data events. VPC Flow Logs record addresses, ports, and whether a flow was accepted or rejected, and they do not copy an HTTP status into the flow line. Caveat: logging has to be enabled on the distribution, or the statistics chart is all you have for the period before logs started. Operational check: open a log line from the error window, read the status and detailed result type, then compare it with the origin's own response for that object.