
The CloudWatch agent on a fleet in us-east-1 is running, and the memory metric never appears in that Region. The agent configuration file sets the Region to us-west-2. Where are the metrics going?
Select an answer to reveal the explanation.
Short Explanation
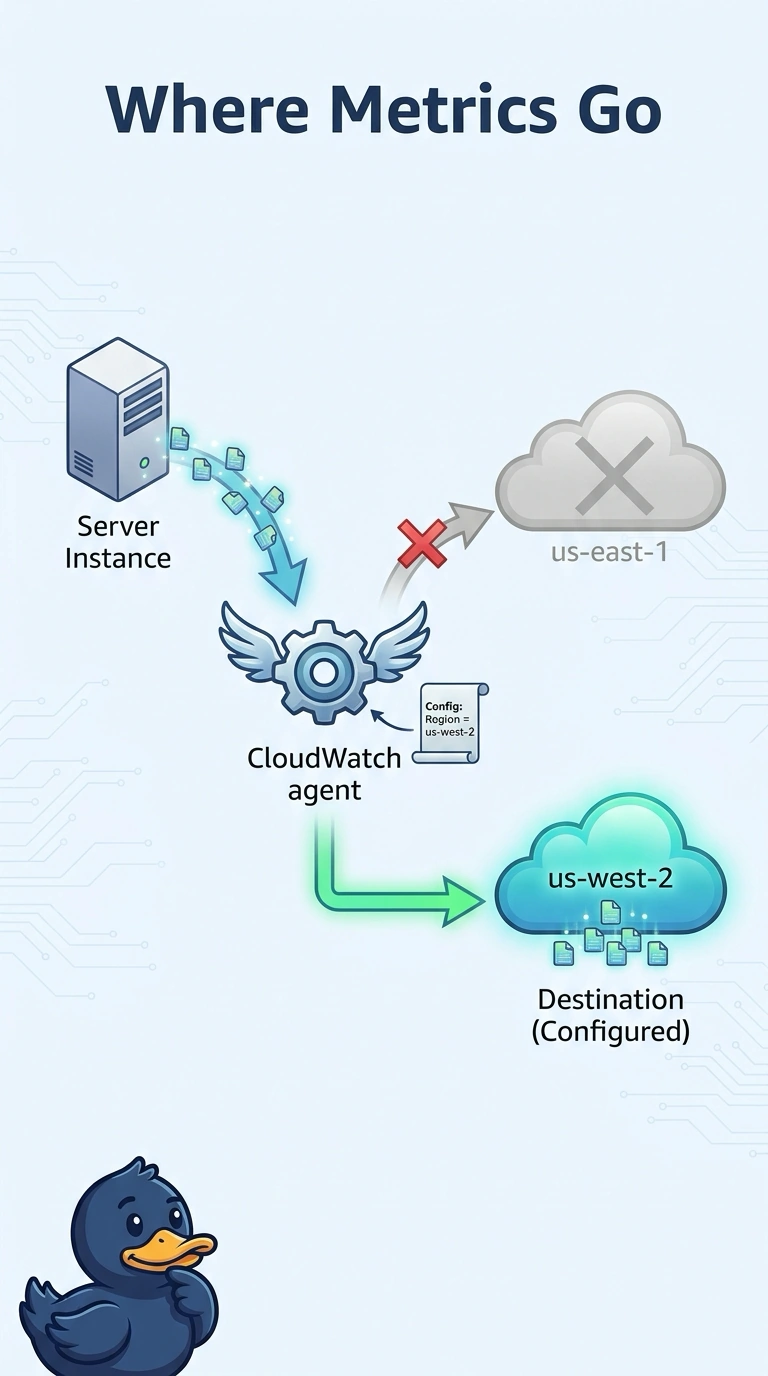
The agent believes the Region you wrote down, not the Region you happen to be looking at. You told it us-west-2, so that is where you go find the memory metric. Staring at us-east-1 and blaming the AMI will not move the series.
Full Explanation
The CloudWatch agent publishes to the Region in its configuration. A file that names us-west-2 sends the memory metric there, which is why the us-east-1 console stays empty while the agent process looks healthy. The AMI's Region does not override that setting. CloudTrail does not receive guest memory metrics. Flow logs are a separate feature and are not the agent's destination. Caveat: if you meant the metrics to live beside the instances, change the configuration to us-east-1 and restart the agent; do not also leave a second config file that still names us-west-2. Operational check: open CloudWatch in us-west-2, find the memory metric, then decide whether to retarget the config or to watch the series where it already is. The agent's common configuration and any file it includes can each set a Region, and the last setting wins. Search the JSON for the region field before you assume the process is broken. Metrics already in us-west-2 stay there; retargeting does not move history. If two teams watch two Regions on purpose, leave the config and tell the us-east-1 operators where to look.