
A global logistics firm centralizes CloudTrail, VPC flow logs, and custom JSON app logs from 40 accounts into a central S3 bucket. Analysts need normalized fields, fast full-text search, and unified dashboards to correlate threats quickly without analysts writing separate queries for each log source. Which logging solution best normalizes, parses, and correlates diverse logs for rapid hunting?
Select an answer to reveal the explanation.
Short Explanation
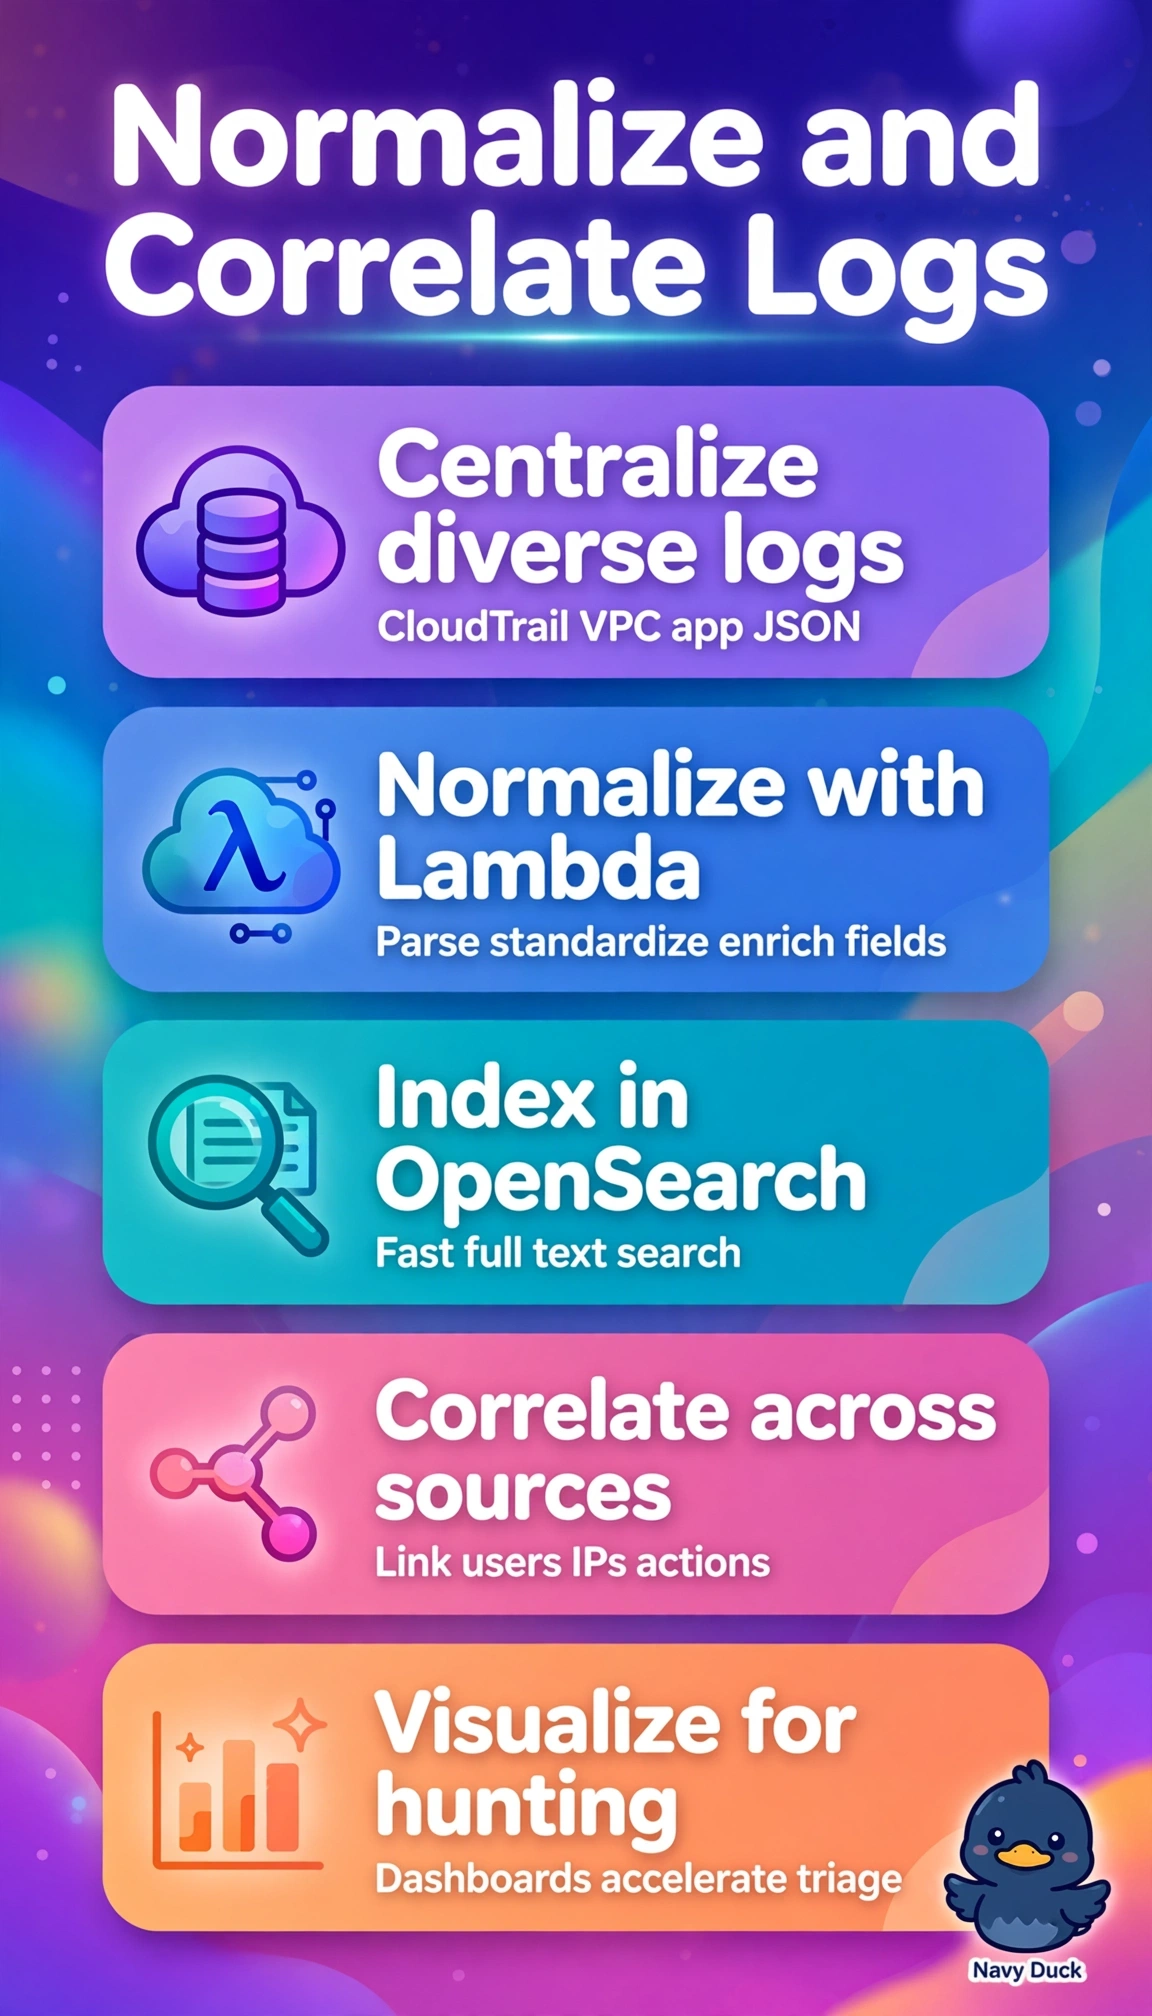
Hunting across messy logs feels like translating five languages at once. Lambda does your normalizing upfront and OpenSearch-indexing gives you one fast, searchable story across every source.
Full Explanation
A Lambda-based ingestion pipeline normalizes disparate CloudTrail, VPC flow, and custom JSON records into a common schema, enriches timestamps and fields, then indexes the documents in Amazon OpenSearch Service where inverted indexes enable fast full-text search, field aggregations, and cross-source correlation dashboards, which directly meets the need for unified hunting from one indexed store. Querying with Athena tables helps by serverless SQL because partitioned tables and views can read raw S3 formats, but it leaves formats unnormalized and requires slower scan-based queries without correlation indexing. Using CloudWatch Logs Insights helps by ad hoc parsing because its query language can extract JSON fields on demand, but it is optimized for single-log-group troubleshooting rather than centralized normalized correlation across 40 accounts. Connecting Managed Grafana directly helps by visualization because Grafana can render Athena-backed dashboards, yet visualization alone does not normalize fields or provide indexed search for threat hunting. Exam caveat: distinguish ingestion and normalization with Lambda plus OpenSearch from pure storage or visualization, and remember OpenSearch requires index mappings and lifecycle management. Practical check: validate the Lambda parser outputs ECS-style fields, confirm OpenSearch index templates and data source dashboards return correlated hits for a test user, IP, and request ID.