
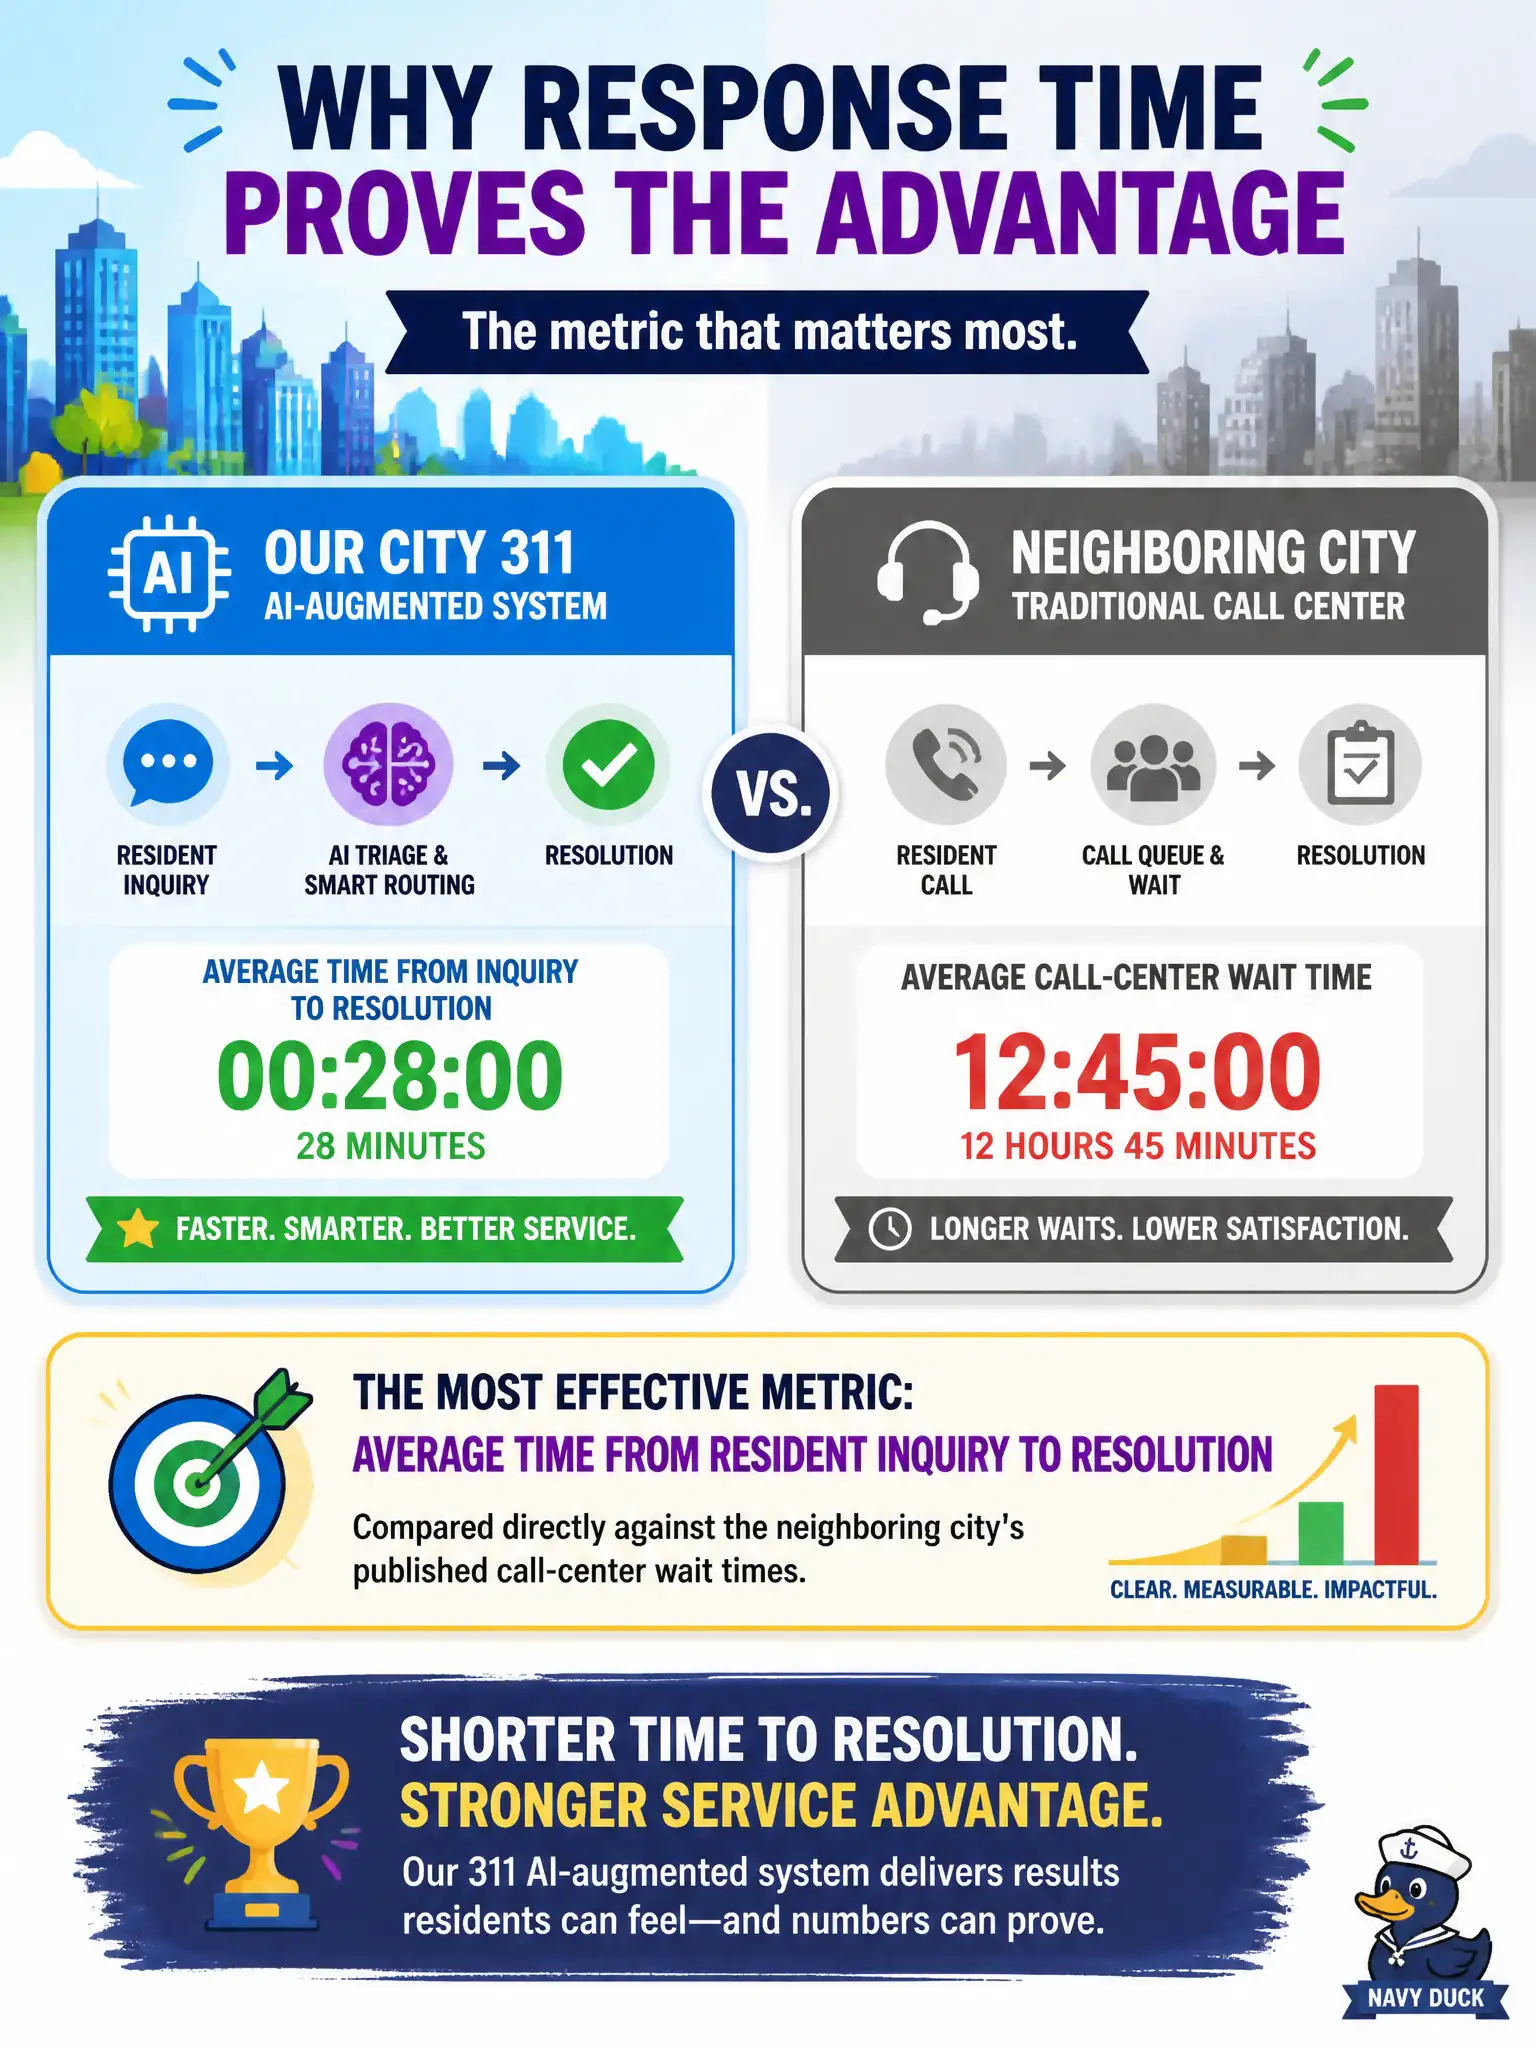
A city's 311 service uses an AI-augmented system to cut average resident response times significantly below a neighboring city's traditional call-center wait times. Which metric would most effectively support the city's claim of a service advantage over its neighbor?
Select an answer to reveal the explanation.
Short Explanation
Think of it like comparing two pizza places by how fast your order actually lands on your doorstep, not by how much either kitchen spent on ovens. The metric that proves a service advantage is the one residents actually feel: how long it takes to get an answer. Everything else, like budgets or vendor counts, doesn't tell your neighbor's residents anything about waiting less.
Full Explanation
Comparative service positioning works best when it's anchored to an outcome the public directly experiences, and time from inquiry to resolution is exactly that kind of metric. Reporting the city's average response time against a neighboring city's published call-center wait times gives stakeholders and residents an apples-to-apples comparison that ties directly to service quality, which is what justifies continued or expanded investment in the AI-augmented system. Counting deployed AI models measures internal technical footprint, not anything a resident feels, so it fails as a positioning metric even though it sounds impressive. Citing the IT budget spent on modernization describes cost, and a bigger number there is not obviously a selling point since it can just as easily suggest inefficiency. Counting vendor contracts signed measures procurement activity, which says nothing about whether service actually improved for residents. One caveat for the exam: a comparison is only credible if both cities measure response time the same way, so a strategist should check that the metrics are defined consistently, such as inquiry-to-resolution versus first-response time, before publishing the comparison.