
A weekly capacity report must aggregate a few fields across millions of historical interface samples. Point lookups of whole device documents are rare. Which database layout best fits the report?
Select an answer to reveal the explanation.
Short Explanation
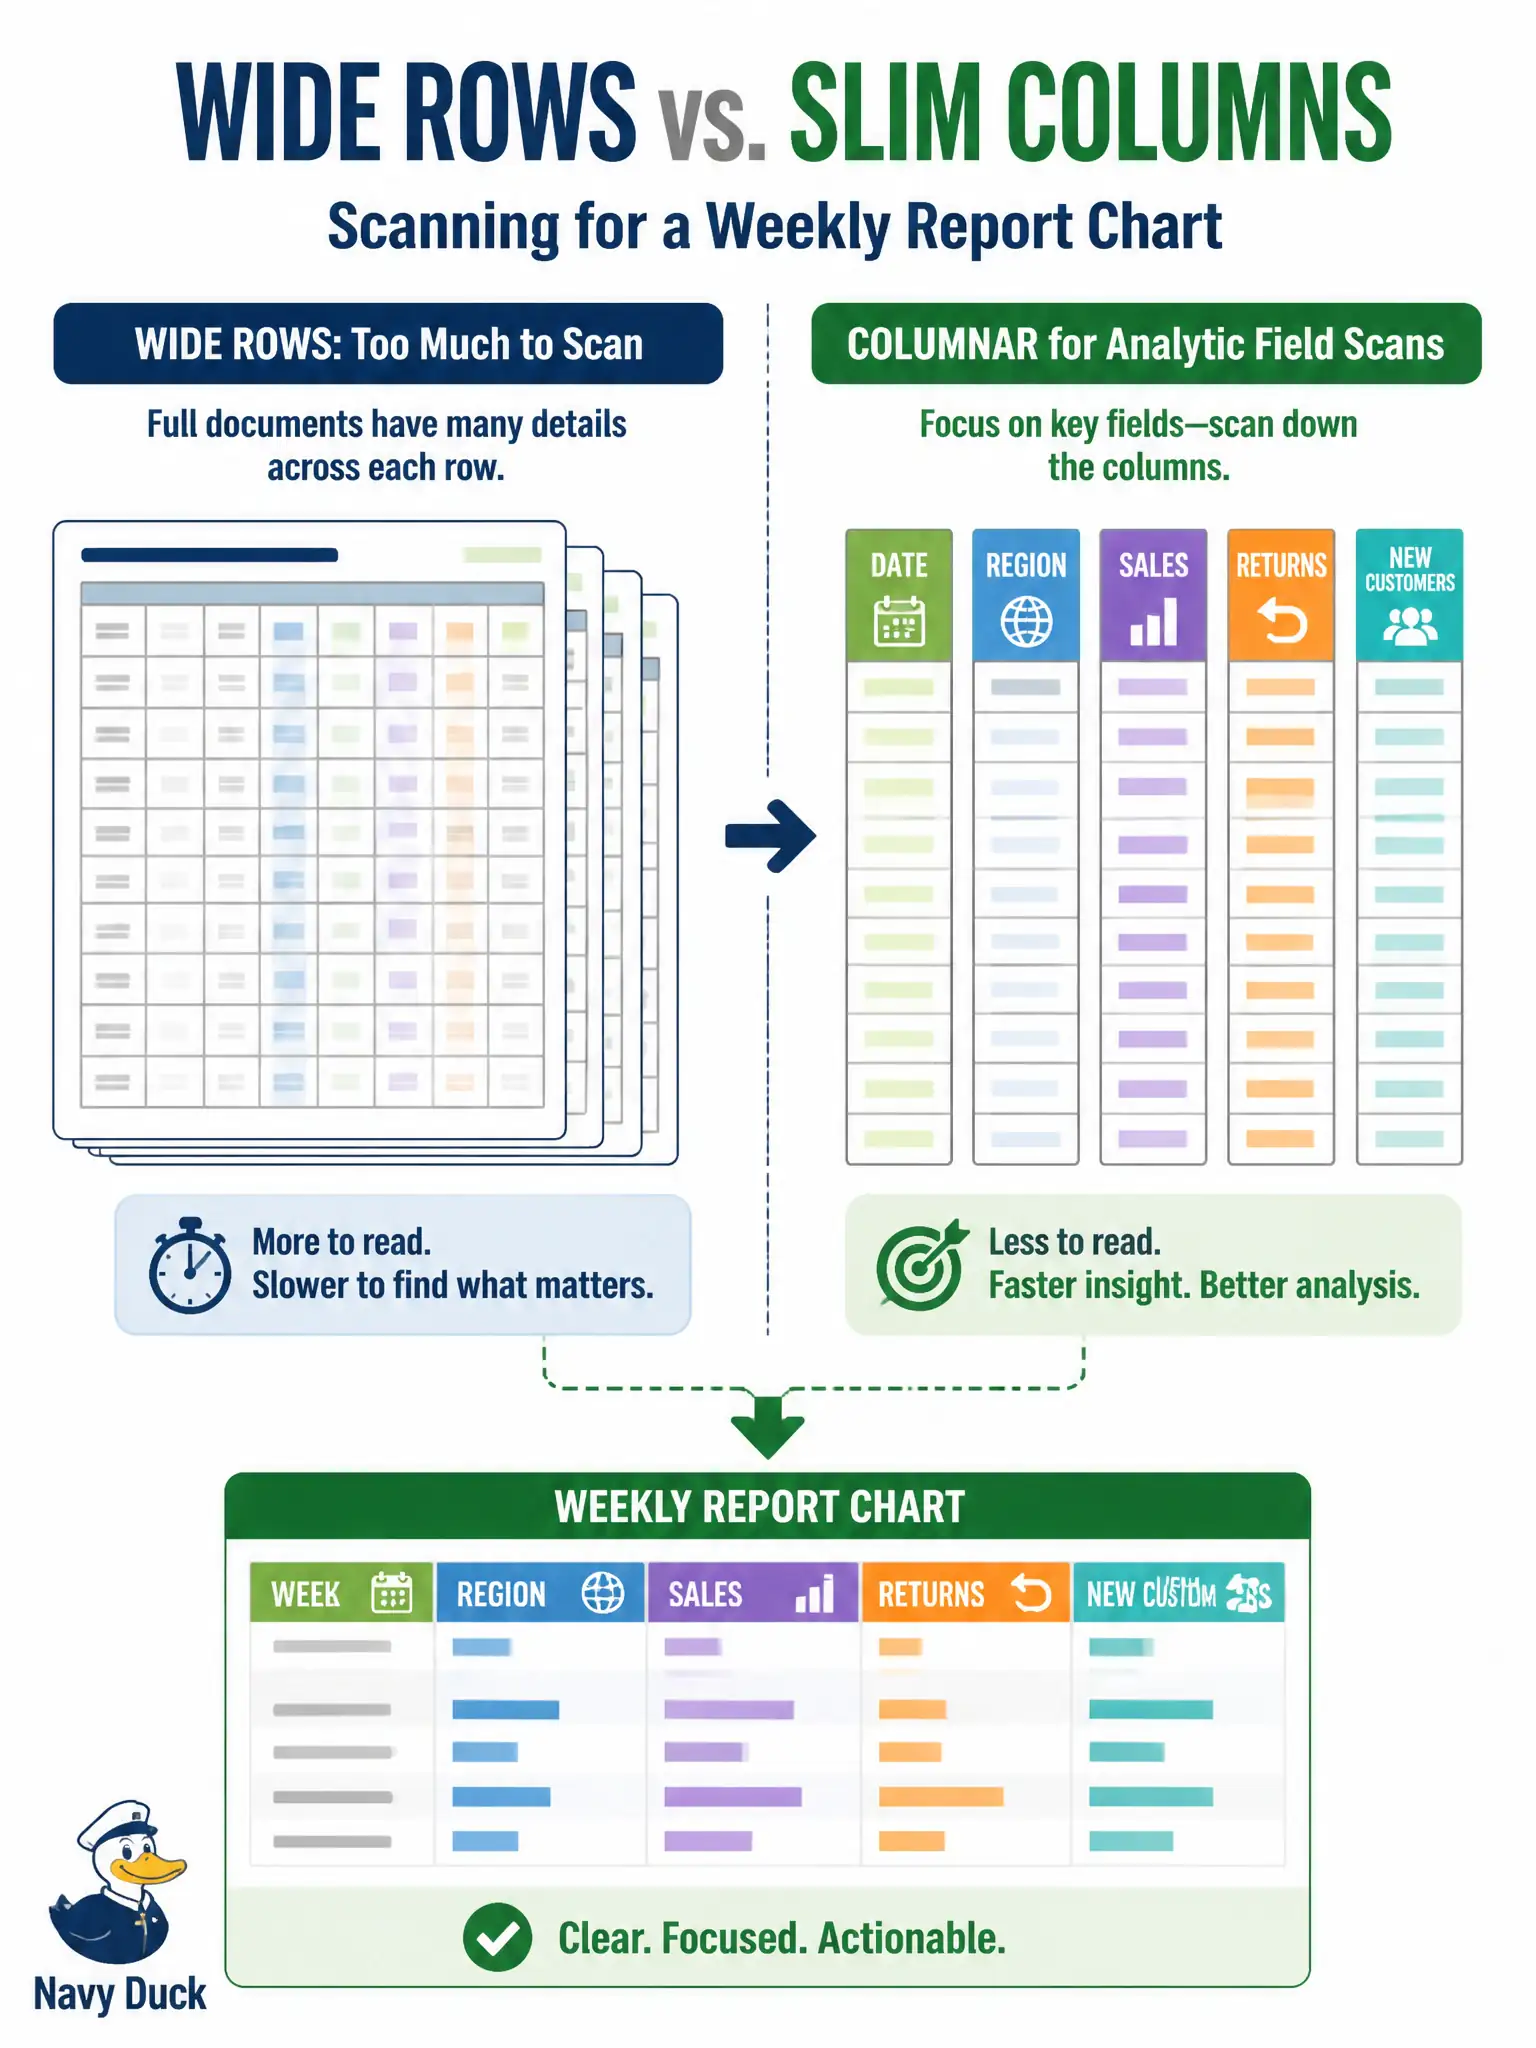
Think of reading only the “temperature” column from a million weather cards stacked by field—not flipping every full card. Columnar layouts make that analytic scan cheap. Hauling whole device documents for a few aggregates is the wrong shape.
Full Explanation
A columnar store that scans only the needed fields across many rows best fits a weekly capacity report that aggregates a few fields across millions of historical interface samples when point lookups of whole device documents are rare. Columnar layouts keep values for the same field together, so reading utilization or errors across a huge historical set avoids hauling every unrelated attribute. That shape makes analytic scans cheap compared with document-oriented retrieval of complete device JSON for every sample.
A document store optimized for fetching entire device JSON blobs fights the report: most of each blob is irrelevant, and scanning millions of full documents for a few aggregates wastes I/O. A graph database because interfaces belong to a topology answers path questions, not wide historical aggregates of a few metrics. An in-memory queue that drops samples after each poll discards the historical depth the weekly report requires and is not a durable analytic store.
Exam caveat: columnar analytic engines are a poor fit for high-rate point updates of entire mutable device documents—match the layout to the report’s scan pattern, not to operational CRUD. Operational check: run the weekly aggregate against a representative million-row sample set measuring bytes read and latency, then compare to fetching whole documents for the same aggregate and confirm the columnar path reads far less data.