
When a slow business transaction crosses a threshold, which AppDynamics capability helps a developer see where time was spent?
Select an answer to reveal the explanation.
Short Explanation
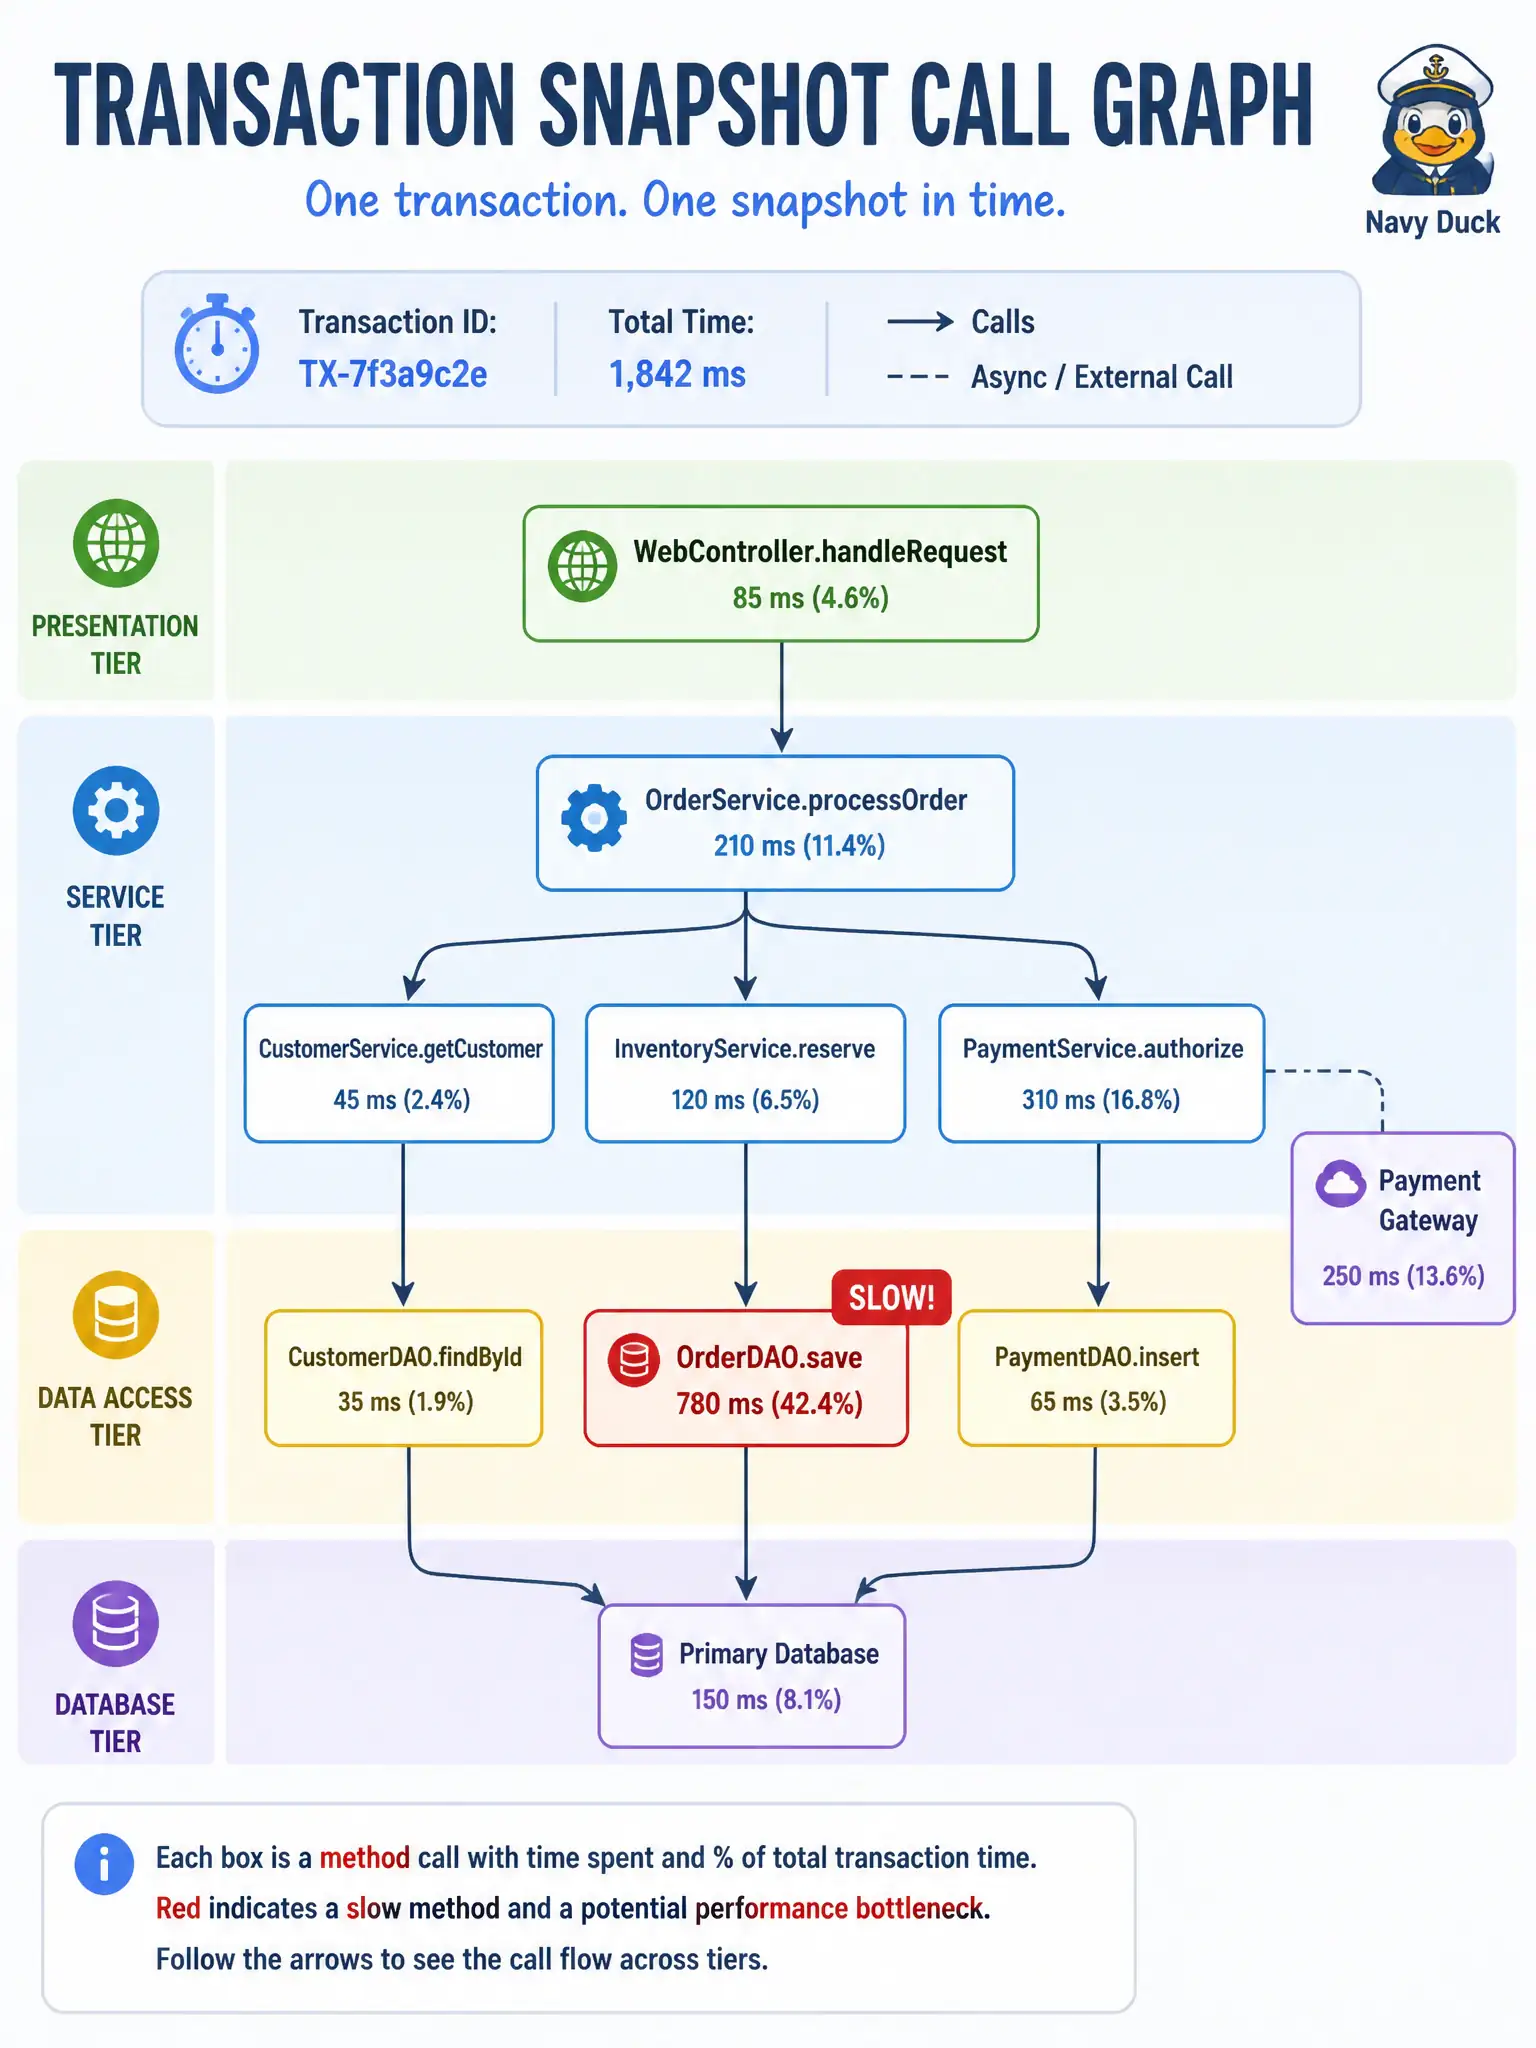
A snapshot/call graph is a slow-motion replay of the errand—which method or backend hop burned the clock—far clearer than a pile of plain logs.
Full Explanation
When a slow business transaction crosses a threshold, AppDynamics transaction snapshots / call graphs show where time was spent across methods and backend hops. That diagnostic view lets developers see whether the delay is in application code, a database exit, or an HTTP call to another municipal service—far more actionable than unstructured logs alone.
Relying only on unstructured application logs without call-level detail fails when the need is precise hop timing inside the transaction. Restarting the VM whenever latency exceeds a static SLA fails as diagnosis: reboot may clear a symptom temporarily but does not identify the slow method or backend. Querying DNA Center client-health as the AppDynamics diagnosis tool fails by platform mix—network assurance client health is not an APM call graph.
Exam caveat: snapshots are sampled under policy; absence of a snapshot for one slow request does not mean the BT is healthy—check health-rule configuration and snapshot collection settings when evidence is missing.
Operational check: reproduce a slow civic transaction, open the snapshot/call graph, identify the hottest exit or method, and file the defect against that dependency rather than restarting VMs as the first response.