
On-call for a city payments stack asks three different questions. Which matching is correct?
Select an answer to reveal the explanation.
Short Explanation
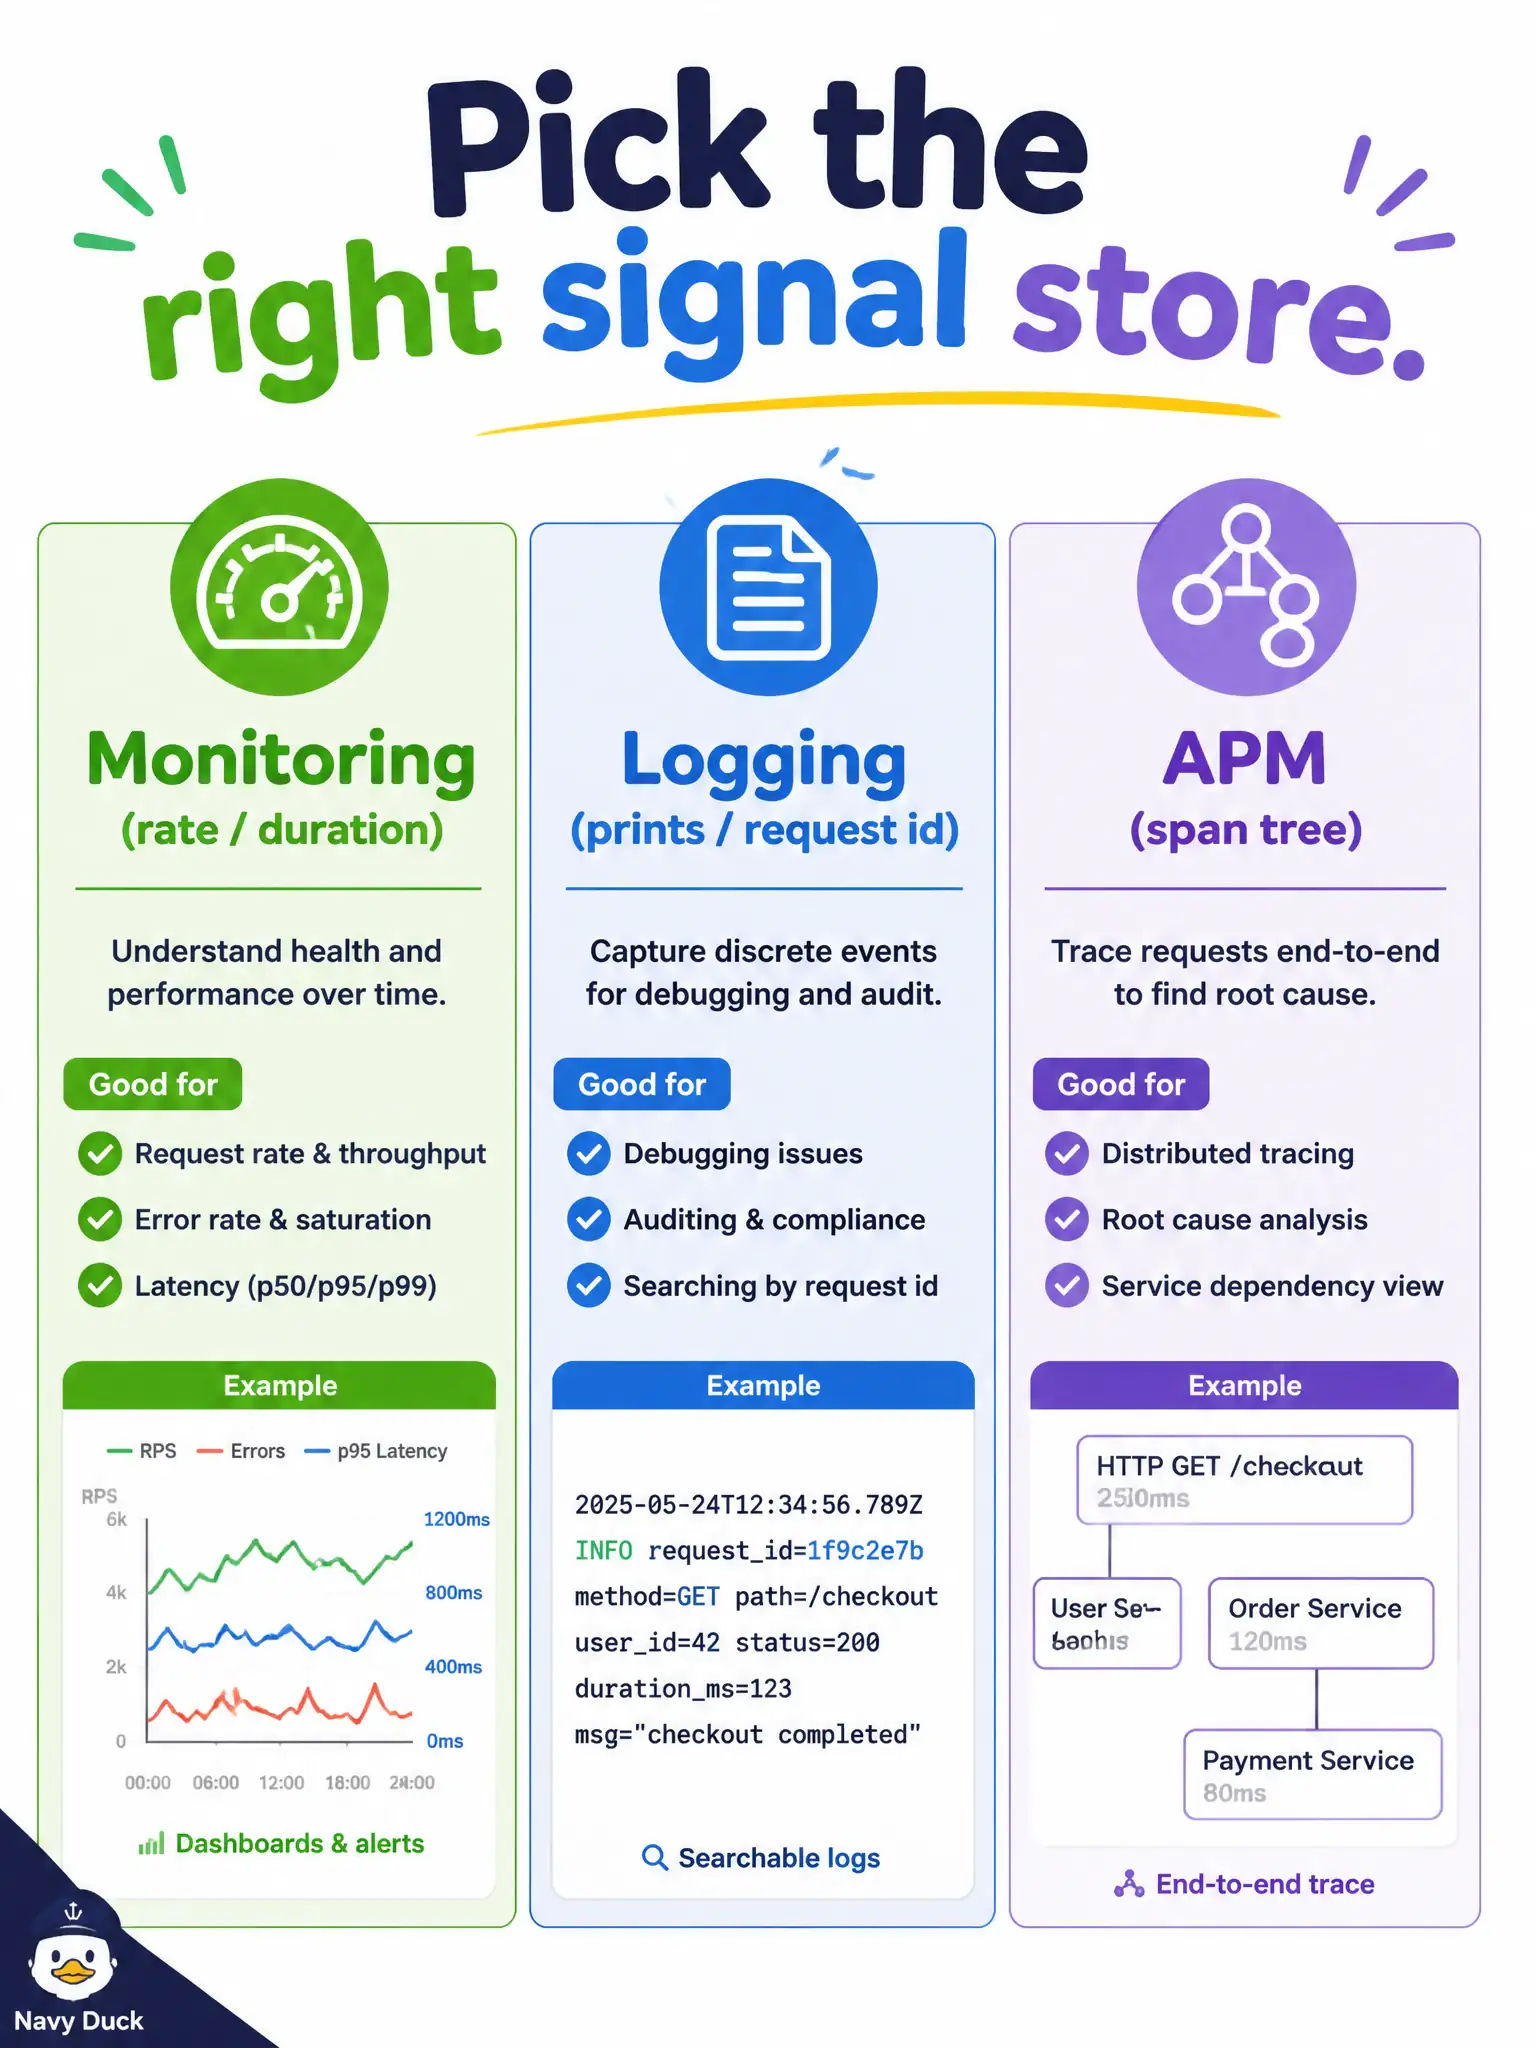
Pick the drawer that fits the question: Monitoring for rates and duration, Logging for printed lines and request ids, APM for the span graph. One store for all three is the anti-pattern.
Full Explanation
Cloud-native troubleshooting on OCI maps questions to tools. Monitoring answers how often, how long, and whether work is throttled—namespaces such as oci_faas, oci_apigateway, and oci_oke. Logging answers what an invocation printed and request identifiers such as opcRequestId for correlation. APM traces answer where time went in the span graph. For a city payments stack on-call asking all three kinds of questions, that three-way matching is the correct practice—not forcing one product to fake the others.
Using only Logging for rate, duration, throttling, span trees, and print lines overloads Logging; it lacks first-class metric aggregates and span trees. Using only Monitoring for opcRequestId print lines and full span trees asks metrics to store logs and traces they do not. Inventing an Observability Hub product as the single store for all three is not the OCI Functions/Monitoring/Logging/APM model taught for this exam domain.
Exam caveat: start with the tool that matches the question type; jumping to custom spans before checking Monitoring errors or Logging prints wastes time when the failure is already visible in metrics or logs. Operational check: for one payments incident, pull error/throttling charts from Monitoring, grab print lines and opcRequestId from Logging, then open the APM span tree only if hop-level timing remains unclear.