
Metrics show a long duration for a zoning-variance Function, but not where time was spent. Where should the developer inspect the request’s span tree?
Select an answer to reveal the explanation.
Short Explanation
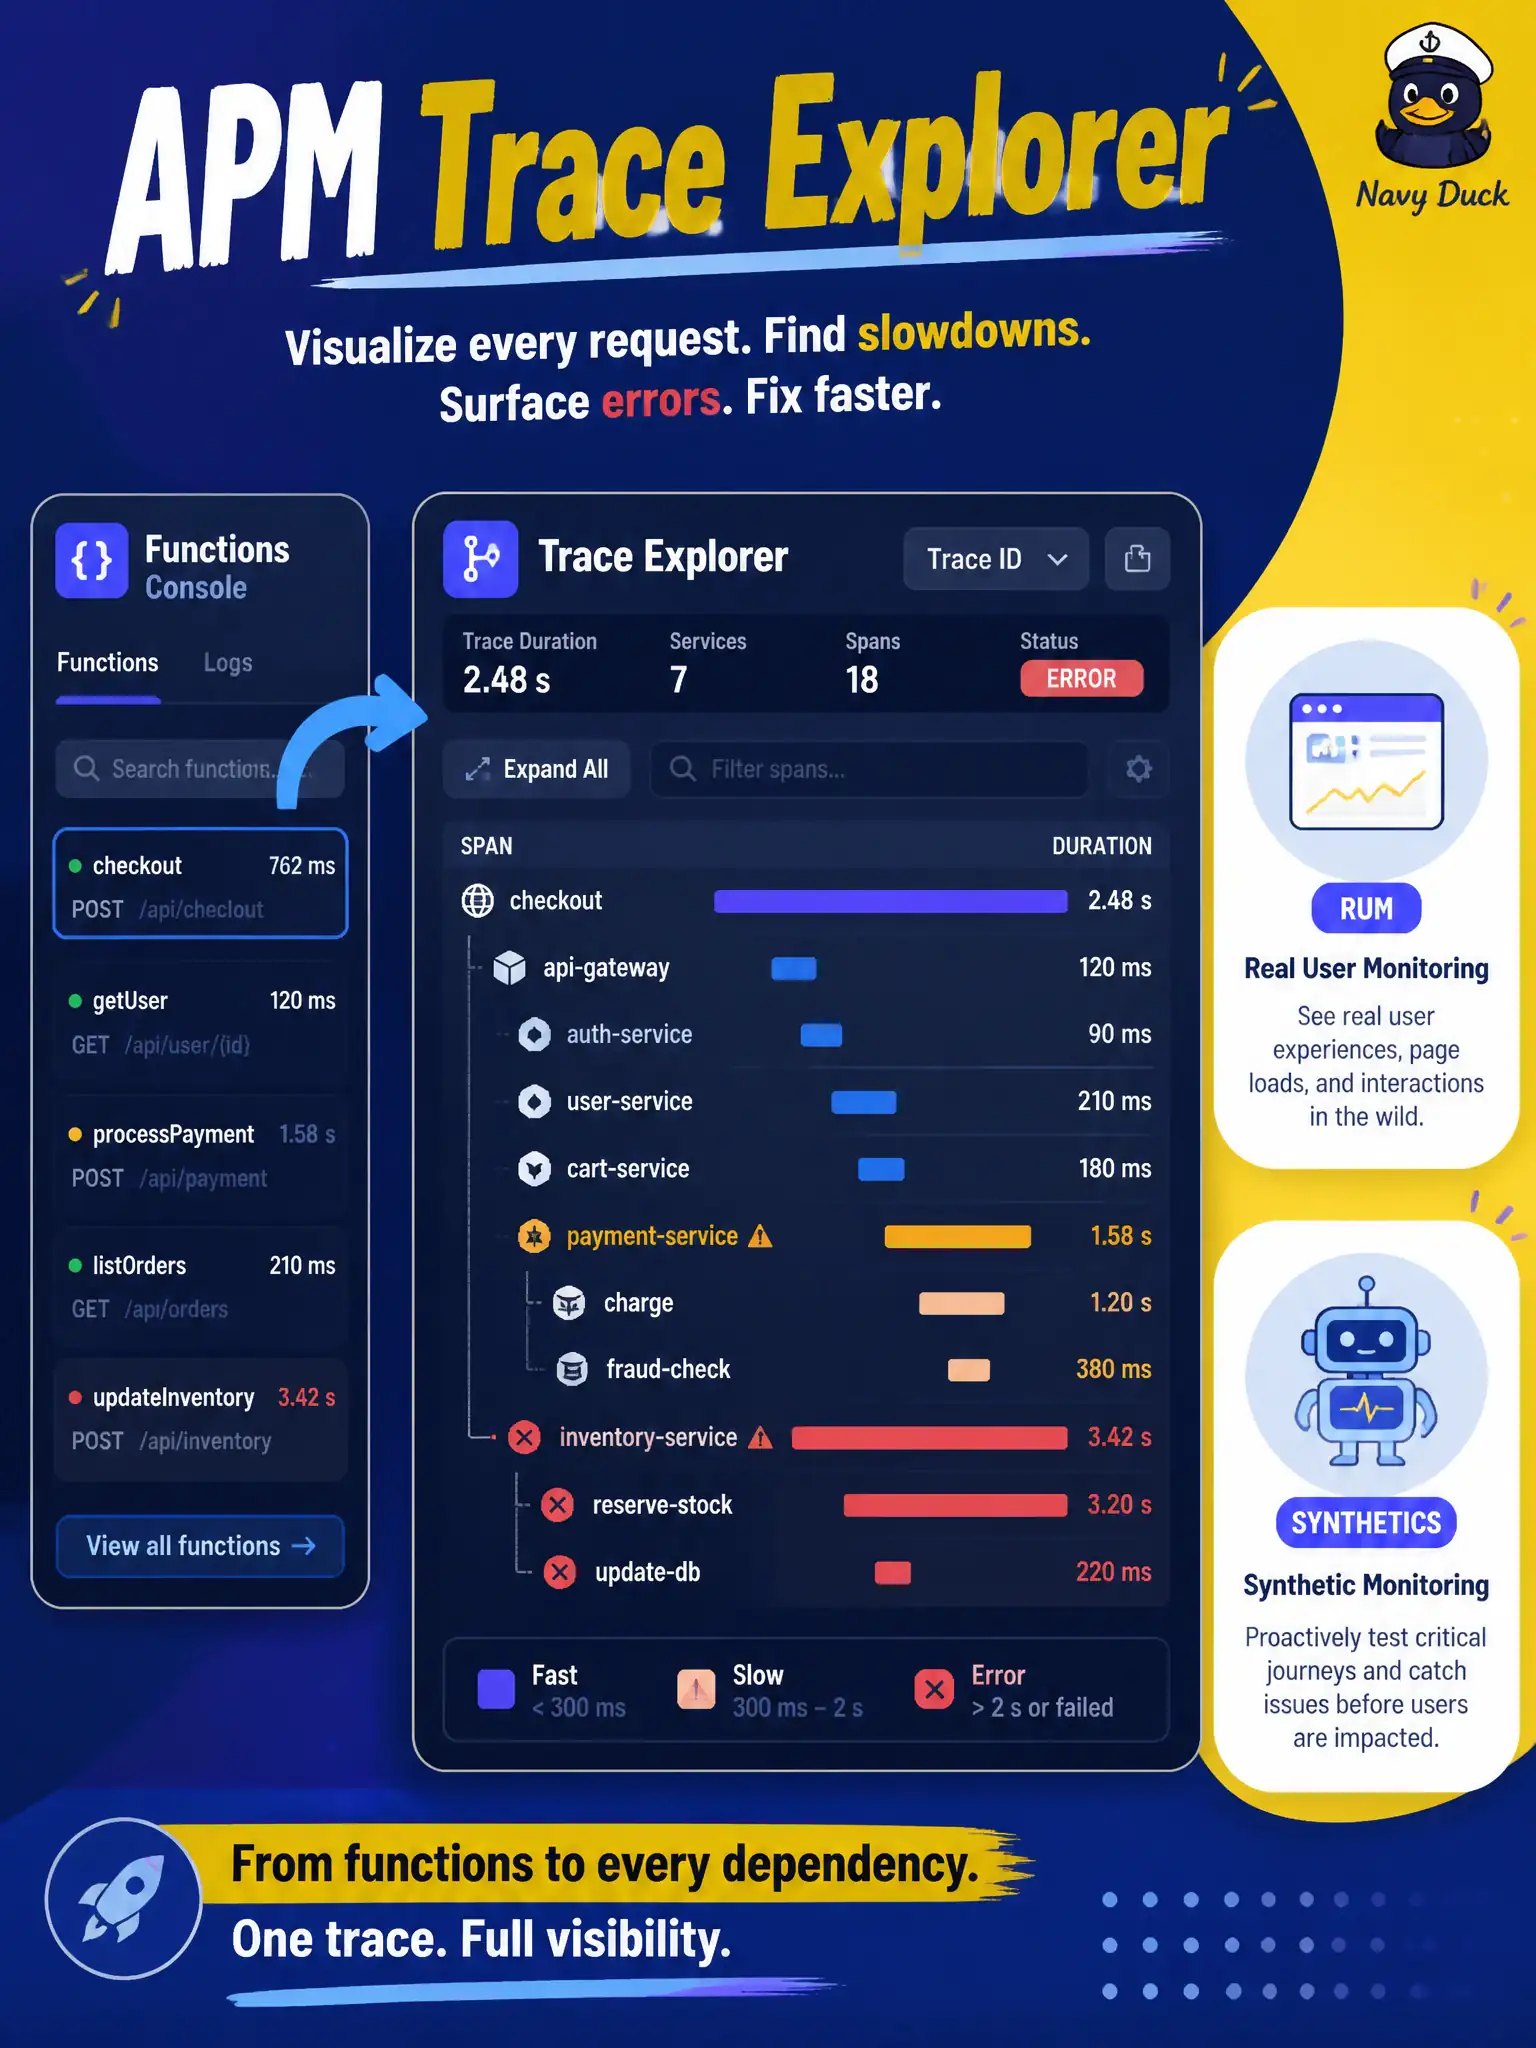
Trace Explorer is the x-ray of the request tree—slow traces and errors included. RUM and synthetics are different APM features, not the Function span-tree how-to.
Full Explanation
When metrics show a long duration for a zoning-variance Function but not where time was spent, you need the request’s span tree. APM Trace Explorer is that view: open from the function’s trace and drill from trace down to individual spans to see which operations dominate. It surfaces slow traces and traces with errors so you can move from "duration is high" (Monitoring) to "this child span is the cost" (APM). That drill-down is the operational difference between knowing the Function was slow and knowing which hop made it slow.
OCI Monitoring alarm suppression history only shows when alarms were muted; it is not a span-tree inspector. RUM session replay focuses on browser user sessions, not server-side Function hop breakdown. Synthetic availability monitors check up/down or scripted probes from outside; they are not the Trace Explorer span-tree UI for an individual Function invocation.
Exam caveat: without tracing enabled and spans present (default plus any custom), Trace Explorer cannot invent a tree—enable tracing before expecting drill-down during an incident. Operational check: from the Functions console open the slow zoning-variance invocation’s trace into Trace Explorer, expand spans by duration, and identify the longest child before changing code or scaling blindly from metrics alone.