
After enabling invocation logs, a tax-assessment Function still shows no diagnostic lines about which parcel ID failed. What else must be true for those custom lines to appear in Logging?
Select an answer to reveal the explanation.
Short Explanation
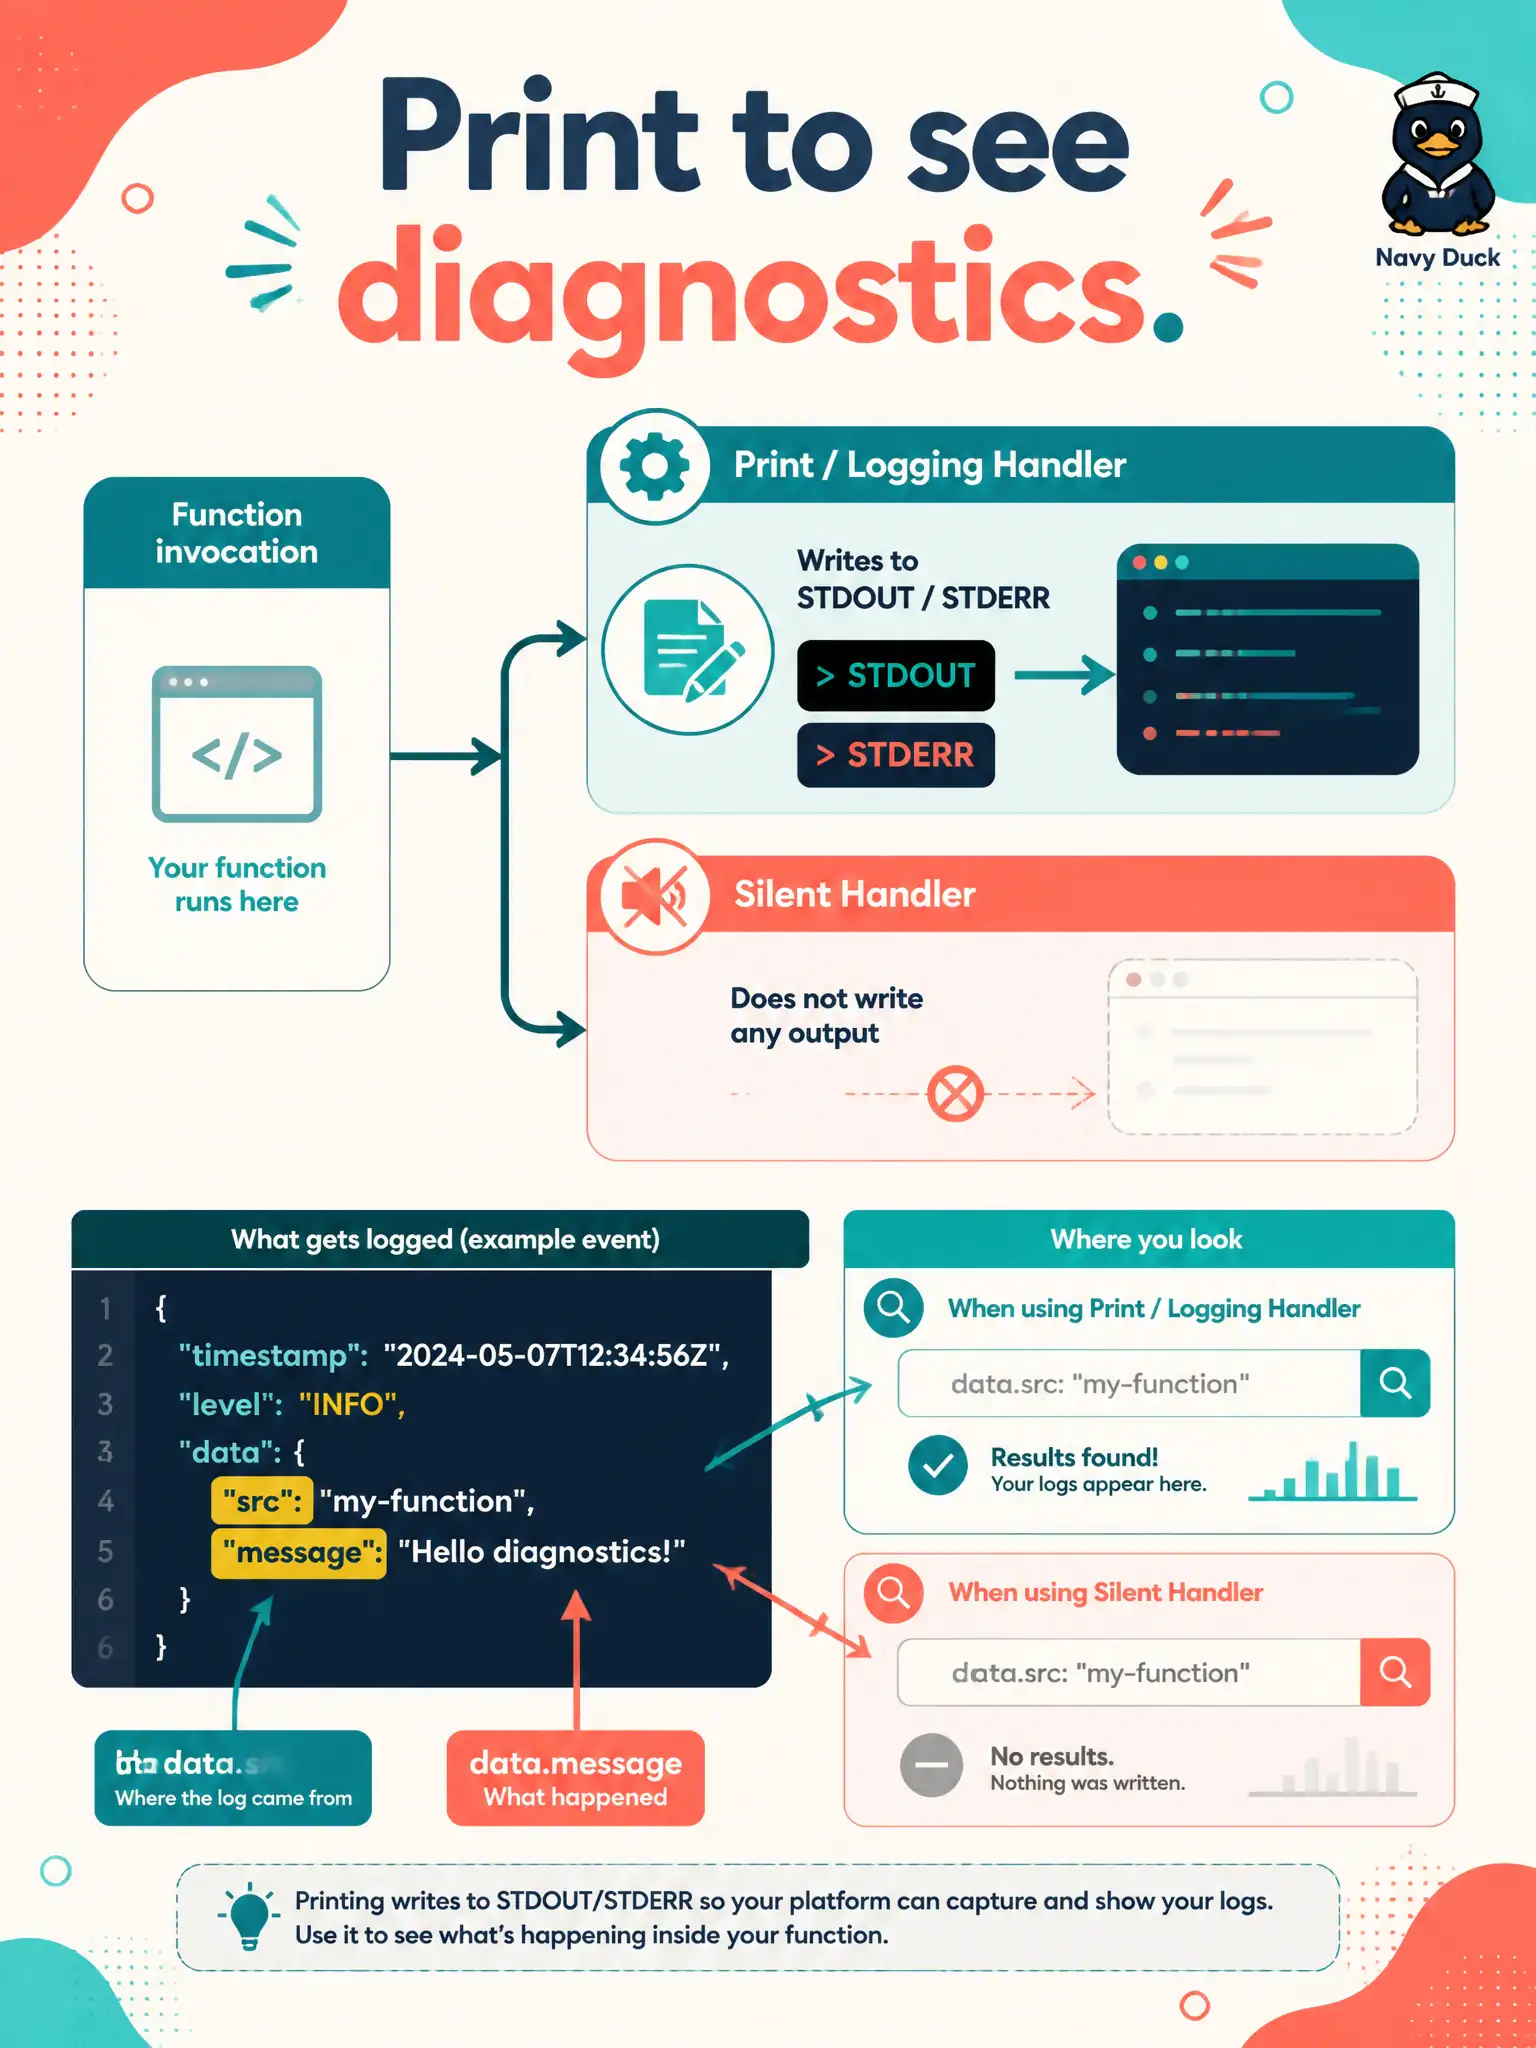
Default invocation records are the ticket stub; your own notes appear only if the handler actually prints. A silent function leaves nothing extra to search.
Full Explanation
Default invocation records from Function Invocation Logs are not the same as your application’s diagnostic narrative. After enablement, custom lines about which parcel ID failed appear only if the handler writes to stdout/stderr or a language logger so events carry fields such as data.src and data.message. A silent handler leaves the platform with little beyond the default invocation stub—nothing searchable about the failed parcel.
The platform does not invent diagnostic lines for every silent handler; absence of prints means absence of those custom fields. Rewriting the function as an OKE sidecar is unrelated—custom lines in Functions Logging do not require migrating to Kubernetes. Disabling Vault secret rotation before any print is stored invents a false dependency; secret rotation policy does not gate whether stdout is captured once logging is enabled.
Exam caveat: enablement of invocation logs is necessary but not sufficient for app diagnostics—code must emit the message, and JSON line format helps if you need structured field filters later. Operational check: add an explicit log line that includes the parcel ID on the failure path, redeploy, reproduce the tax-assessment error, and confirm data.message (and related fields) appear in Logging Search for that invocation.