
A city parking-permit portal team wants a Monitoring chart that shows peak API Gateway request volume during permit renewals. Besides the metric name in the oci_apigateway namespace, which two other pieces must the metric query include?
Select an answer to reveal the explanation.
Short Explanation
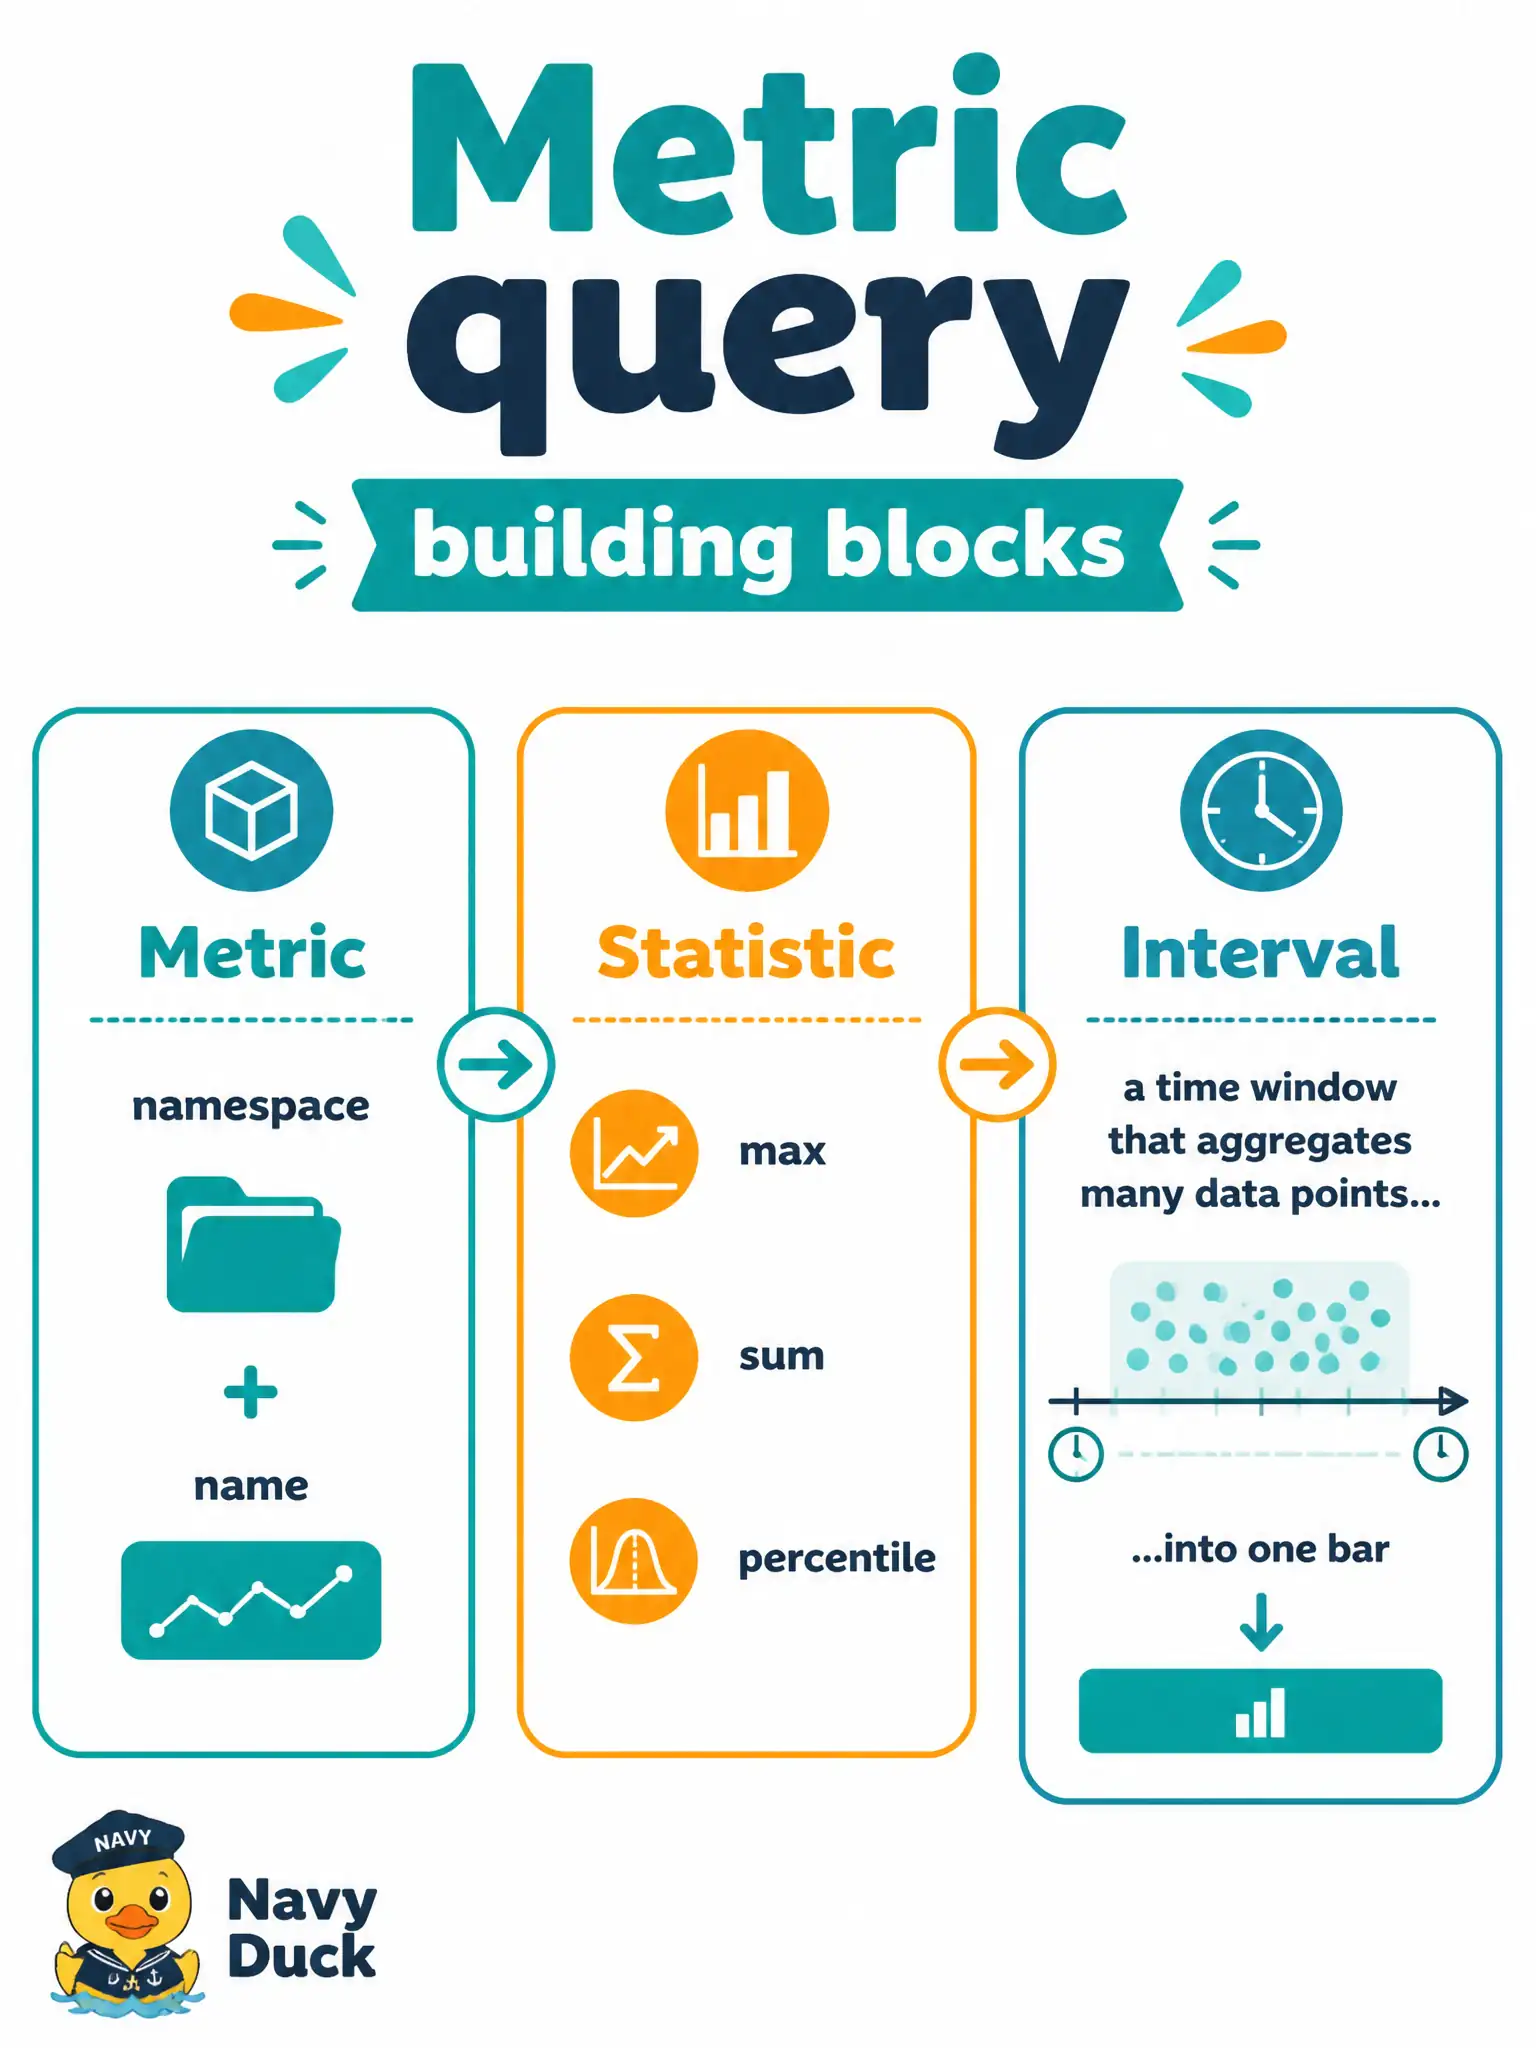
Think of a metric query like a recipe card: which signal, how you summarize it, and over what time window. Without the statistic and interval, raw points never become the one number a chart or alarm can judge.
Full Explanation
A Monitoring metric query is not complete with a namespace and metric name alone. OCI Monitoring expects you to choose a statistic—max, sum, mean, percentile, or similar—and an interval that aggregates raw emission points into one value per window. That pair is what Console charts and alarms actually evaluate: peak permit-renewal volume on API Gateway becomes a usable series only when each interval collapses many request counts into a single statistic. Without it, you have scattered points, not a chart that answers "how high did renewals get."
A Notifications topic OCID and a Connector Hub task belong to alarm destinations and data movement, not to the definition of the metric query itself. Wiring those pieces can deliver or transform alarm traffic later, but they never replace statistic and interval on the query that feeds a chart. An APM domain data key and Zipkin collector URL are for distributed tracing into Application Performance Monitoring; they do not assemble Monitoring chart series in the oci_apigateway namespace. A Logging log group OCID and custom log agent config govern where log lines land and how agents ship them; they are orthogonal to metric aggregation for request-volume charts.
Exam caveat: dimensions and filters refine which series you plot, but they still sit on top of a query that already has statistic and interval—filters alone do not invent the aggregate. Operational check: in the Console Metrics Explorer (or equivalent MQL), confirm the query returns one value per interval for the chosen statistic during a renewal window, then pin that same query shape into any alarm you later create for the parking-permit portal.