
Service Metrics for oci_faas shows noise from every Function in the compartment. How should an operator isolate one permitting Function’s charts?
Select an answer to reveal the explanation.
Short Explanation
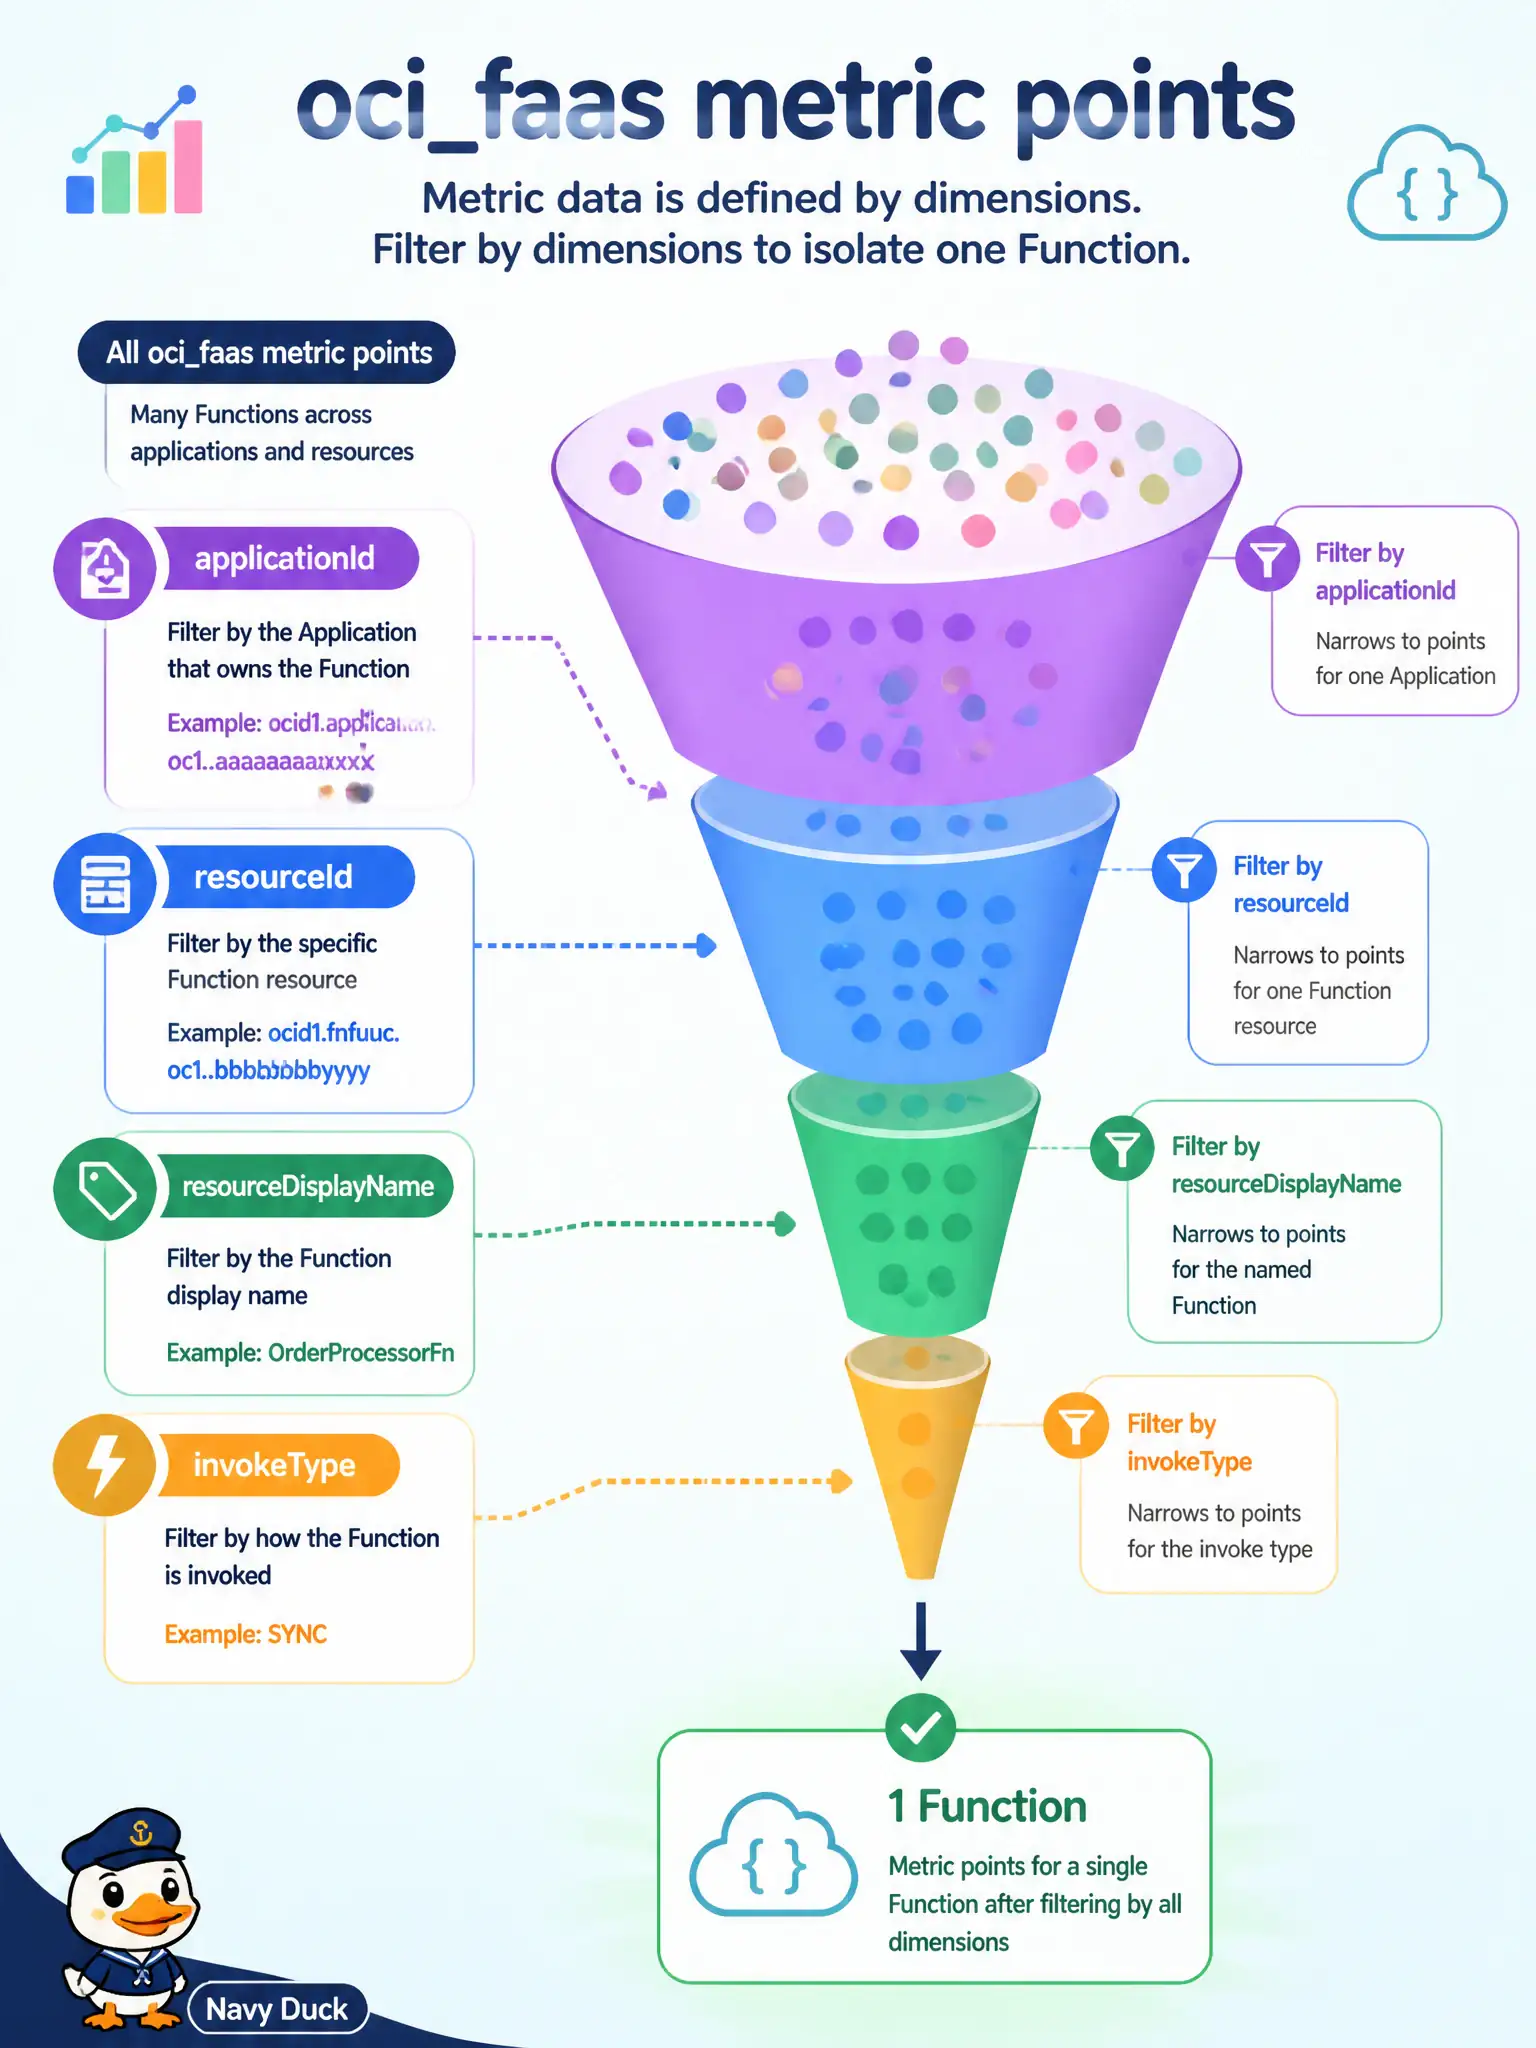
Dimensions are colored tags on each metric point—application, function id, name, invoke type—so you can zoom from the whole compartment down to one Function.
Full Explanation
When Service Metrics for oci_faas is noisy with every Function in the compartment, isolate one permitting Function by filtering or grouping on dimensions such as resourceId or resourceDisplayName, along with related fields like applicationId or invokeType where useful—or simply open that function’s own Monitoring charts, which are already scoped to the resource. Dimensions are labels on each metric data point that make compartment-wide views drillable down to a single municipal Function without restructuring tenancy layout.
Creating a new tenancy per function because dimensions supposedly cannot filter oci_faas metrics is unnecessary and operationally extreme; dimensions exist precisely for filtering. Exporting all metrics to Object Storage and disabling Monitoring dimensions permanently abandons interactive Monitoring and removes the filter mechanism you need. Switching exclusively to Logging search because metric dimensions are not supported for Functions is false—Functions metrics support dimensions, and logs are a different telemetry type.
Exam caveat: dimension names must match what oci_faas actually emits; filtering on a custom tag that was never attached as a metric dimension yields empty charts even though the Function is healthy. Operational check: in Service Metrics, set namespace oci_faas, filter resourceId (or resourceDisplayName) to the permitting Function, compare with the function’s Monitoring tab, and confirm invocation series align for the same interval.