
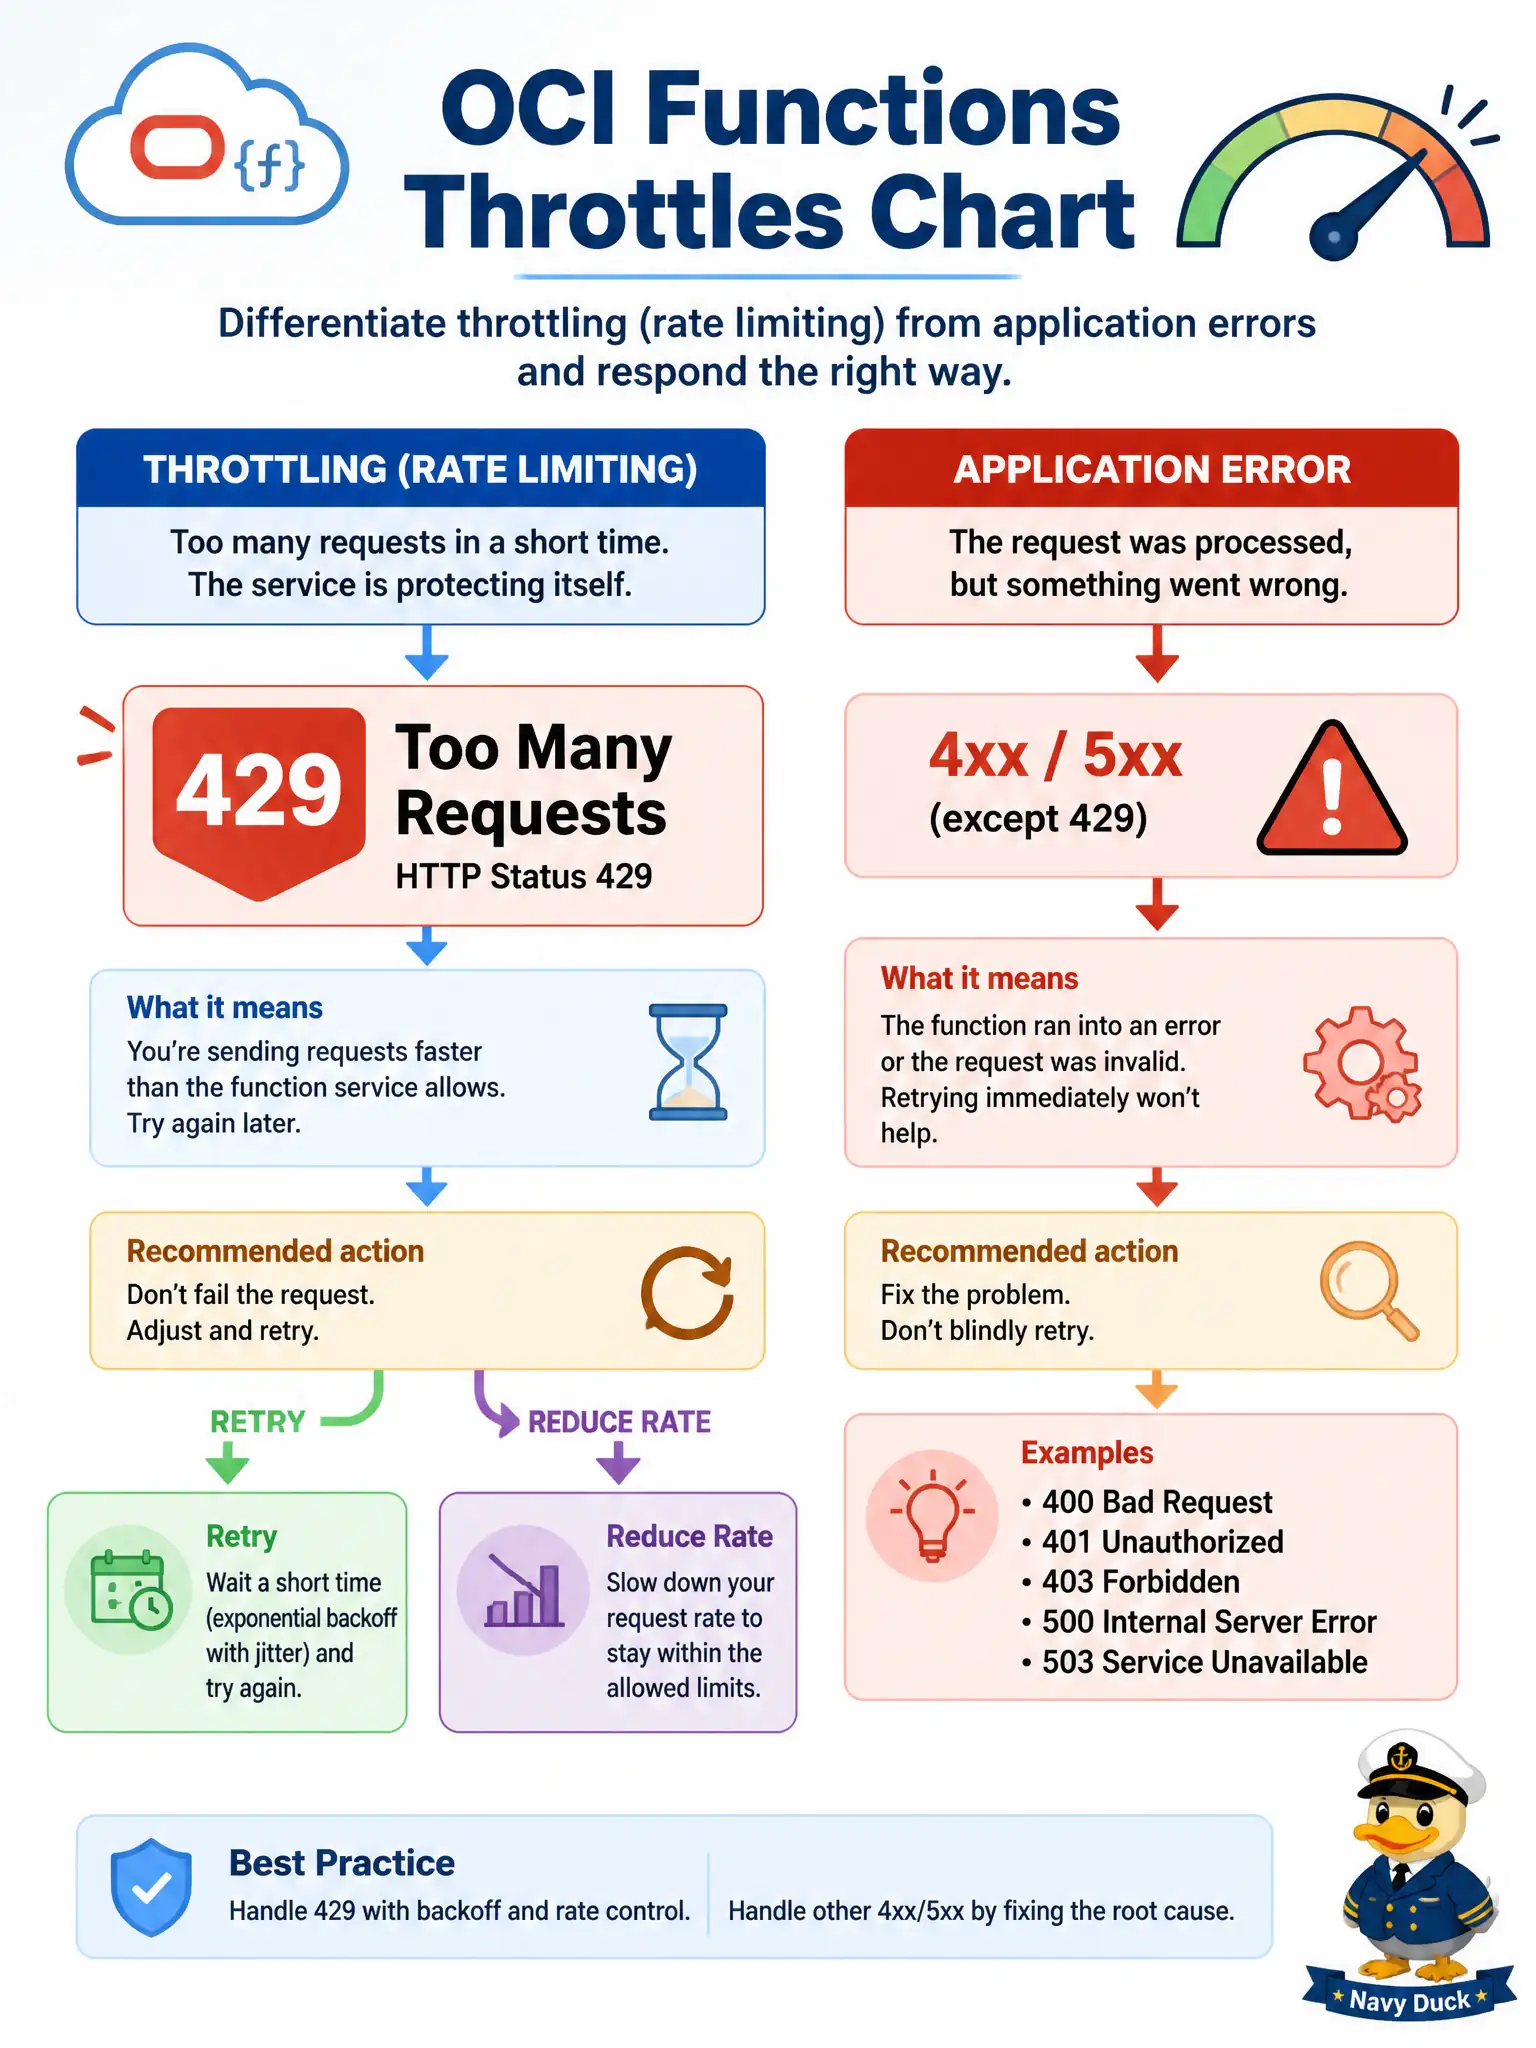
The Throttles chart for a city’s notifications Function lights up during a mailing spike. What does a throttled invocation mean, and what should developers do first?
Select an answer to reveal the explanation.
Short Explanation
Throttled is a busy-signal 429, not a crash inside your code. Back off and retry—do not treat it like a handler bug or flip on Service Mesh.
Full Explanation
When the Throttles chart lights up for the city’s notifications Function during a mailing spike, a throttled invocation means the request received HTTP 429 Too Many Requests. That is a platform capacity or invoke-rate signal, not proof that the handler threw an application exception. Documented first responses are to retry with appropriate backoff and to reduce invoke rate (or scale concurrency/limits as designed)—not to treat throttling as a code defect requiring framework rewrites.
Assuming the handler threw an uncaught exception and that the fix is to rewrite the FDK and enable Service Mesh misreads throttle as error and drags in unrelated mesh controls. Assuming the function ran successfully but slower than an alarm threshold, so memory alone must increase, confuses duration/performance tuning with 429 throttling. Claiming throttles mean Logging was disabled and that throttles are log-ingestion failures unrelated to HTTP status invents a Logging outage narrative; the Throttles chart reflects invoke throttling, not log pipeline health.
Exam caveat: Error and Throttled can both rise in a spike for different reasons—inspect responseType breakdown before changing application code. Operational check: confirm 429s in invoke results or metrics, add client-side retry/backoff for the mailing job, lower burst rate, re-run a controlled send, and verify the Throttles series declines while Success responses recover.