
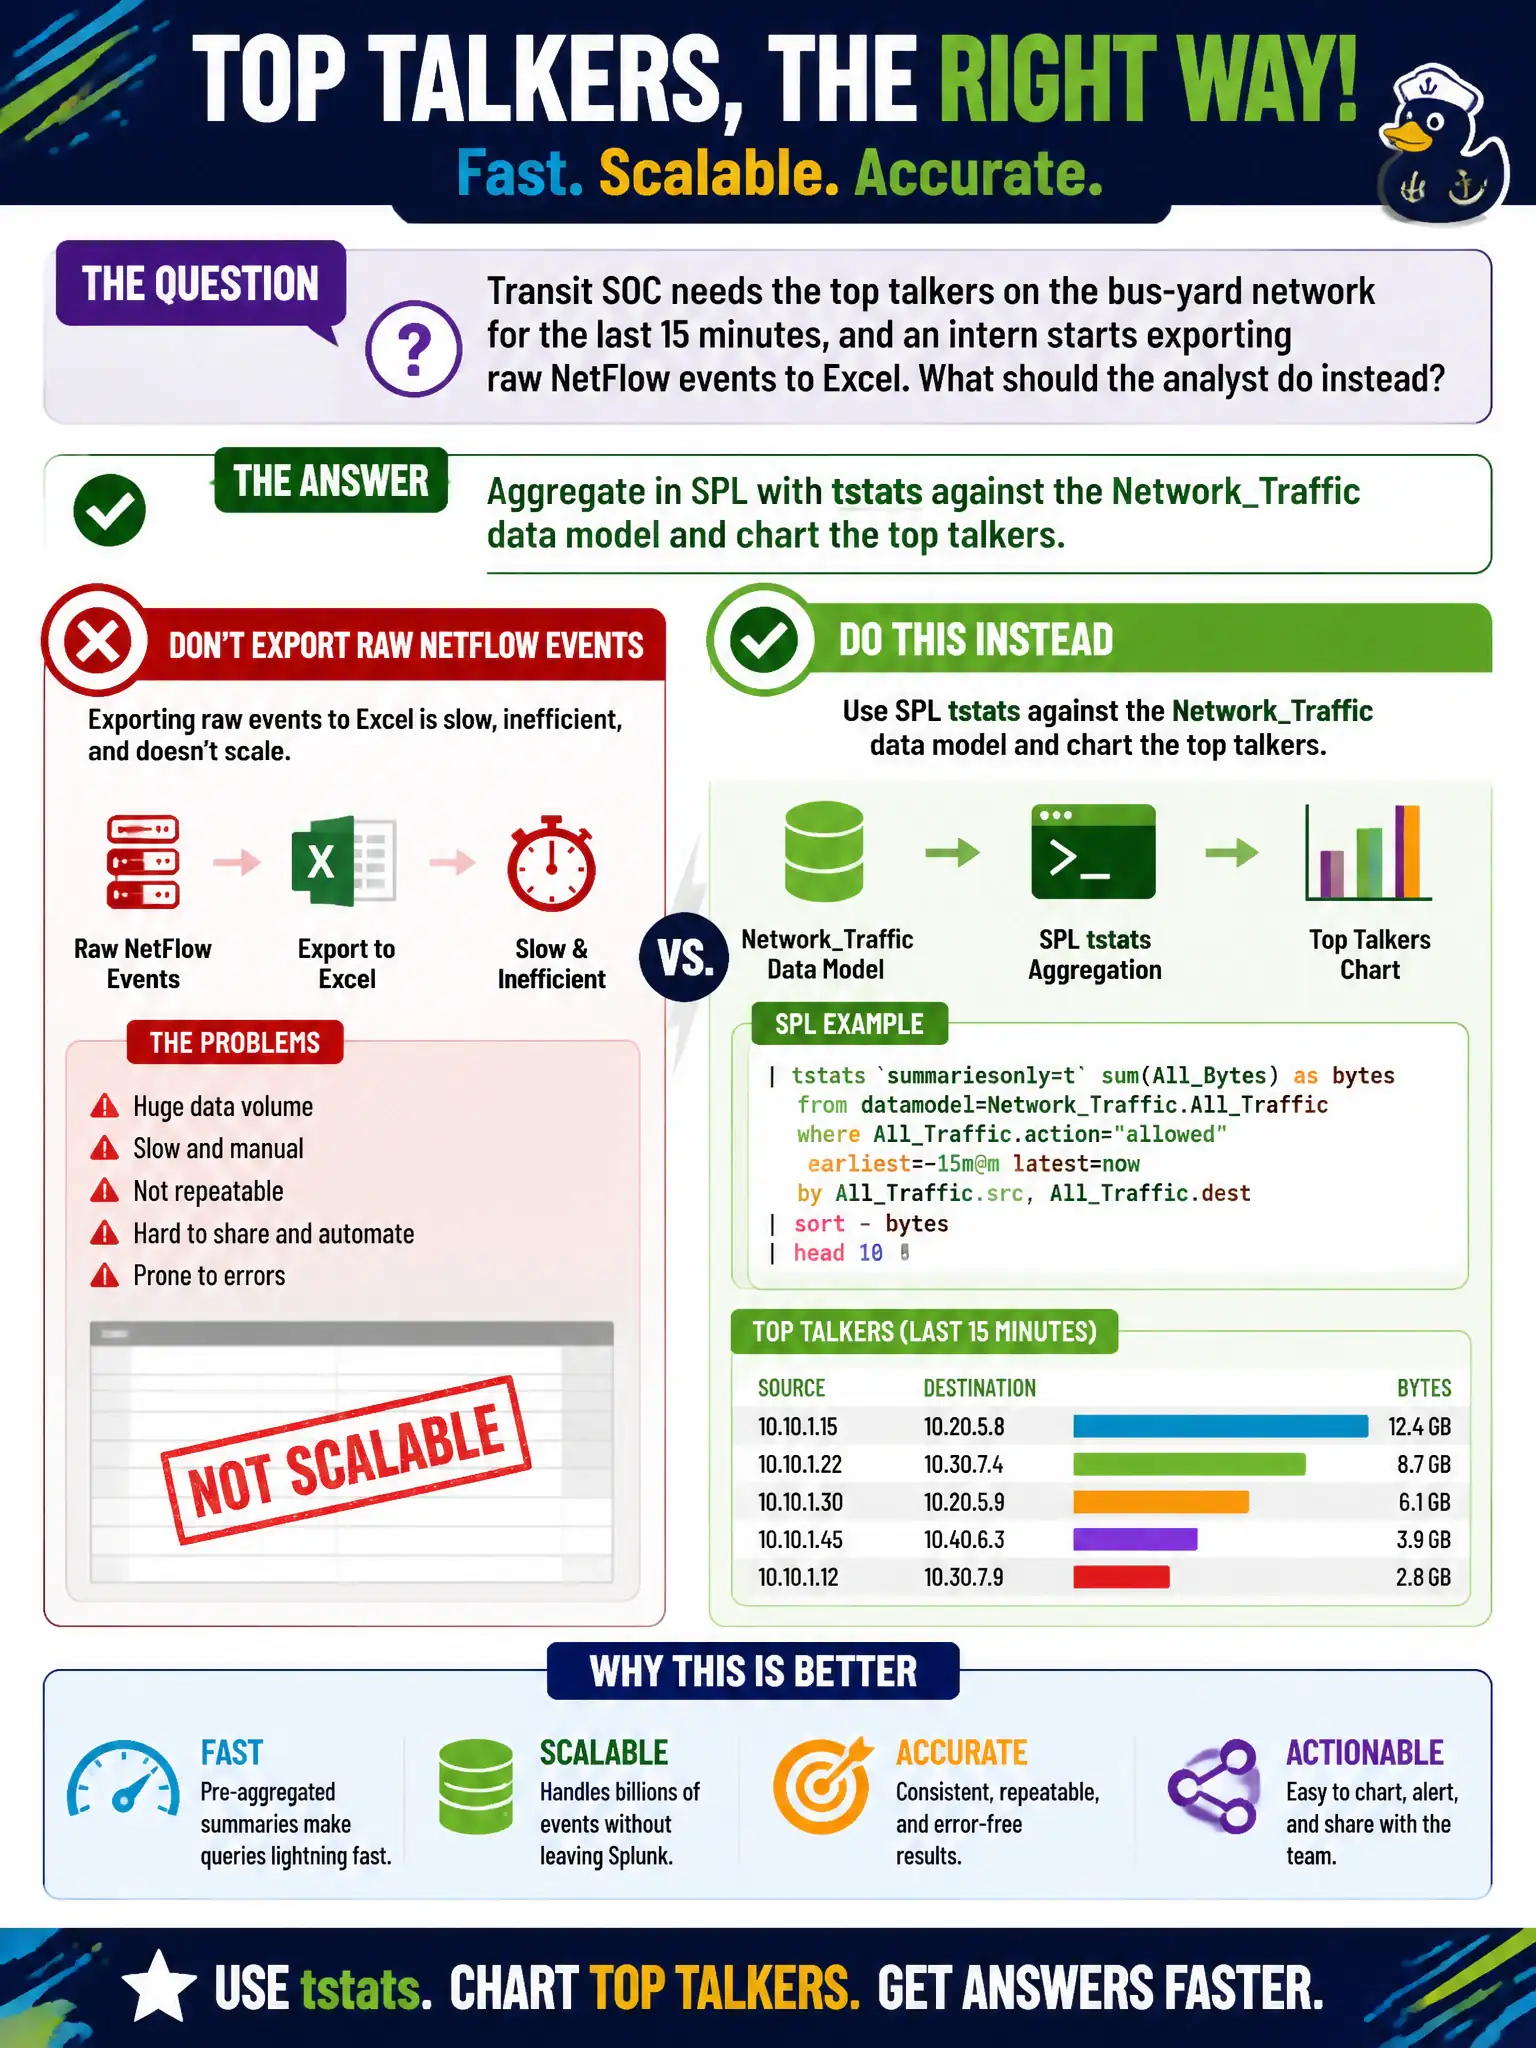
Transit SOC needs the top talkers on the bus-yard network for the last 15 minutes, and an intern starts exporting raw NetFlow events to Excel. What should the analyst do instead?
Select an answer to reveal the explanation.
Short Explanation
Do not dump the bus-yard firehose into a spreadsheet and hope PivotTables keep up. Keep the top-talker math in Splunk: tstats on the accelerated Network_Traffic model, then chart. Excel is for the slide, not for aggregating civic NetFlow.
Full Explanation
Top-talker analysis on the bus-yard network belongs in Splunk aggregation, not in an Excel dump of raw NetFlow. With a healthy accelerated Network_Traffic data model, tstats plus charting returns top talkers for the last 15 minutes without exporting packet-level rows to a spreadsheet. Downloading 24 hours of raw NetFlow for PivotTables turns the briefing into an aggregation engine the SIEM already provides. index=* with transaction src dest over all time is both an efficiency and scoping failure for a 15-minute top-talker question. Disabling data-model acceleration so Excel can see every field actively removes the fast path transit SOC needs. Exam caveat: Excel may still format a slide, but the math—bytes, sessions, top talkers—should be completed in SPL against summaries or constrained indexes. Operational check: run tstats on Network_Traffic for the bus-yard segments over 15 minutes, chart top talkers, export only the aggregate table for leadership, and retire the raw NetFlow-to-Excel habit from the transit runbook. Document the revised approach in the civic SOC runbook so the next on-call analyst inherits the correct pattern rather than the anti-pattern. Retain Job Inspector evidence with the change ticket for municipal audit readiness.