
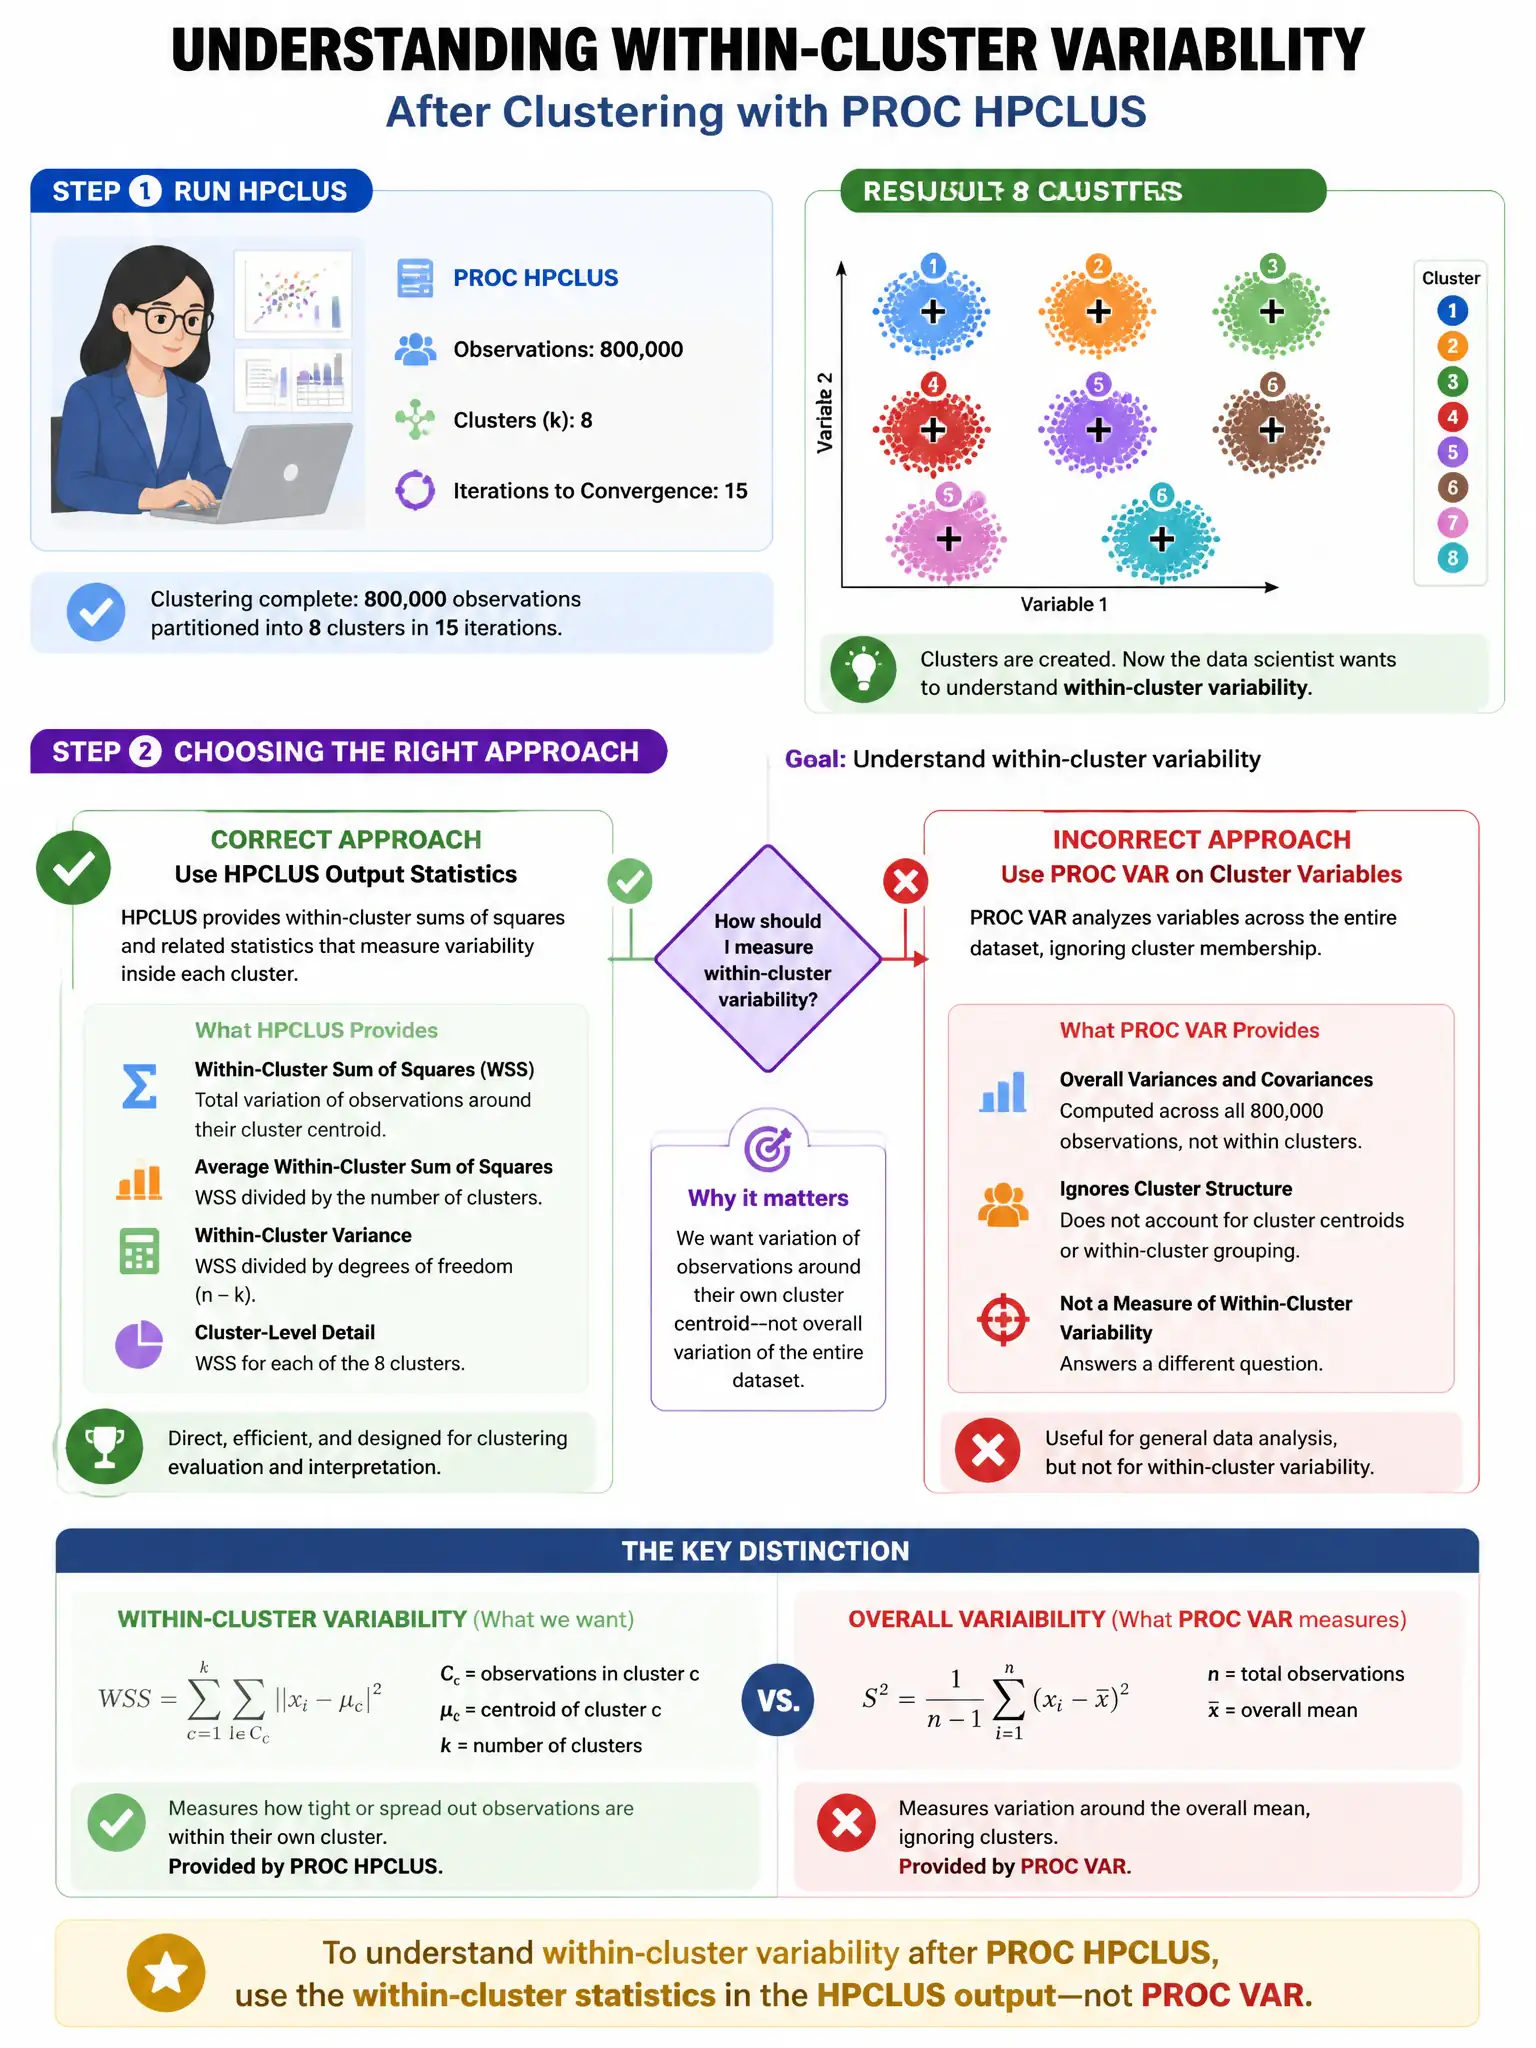
A data scientist applies PROC HPCLUS to 800,000 observations with k=8 clusters and converges in 15 iterations. The data scientist then wants to understand within-cluster variability. Which statistic output by PROC HPCLUS directly measures within-cluster variability?
Select an answer to reveal the explanation.
Short Explanation
Here's the deal — you want within-cluster variability, so choose the Root Mean Square Standard Deviation per cluster. PROC HPCLUS reports RMSSTD for each cluster, which measures the average within-cluster standard deviation across all variables and directly quantifies compactness.
Full Explanation
The Root Mean Square Standard Deviation per cluster is correct because PROC HPCLUS reports RMSSTD for each cluster, which measures the average within-cluster standard deviation across all variables — directly quantifying within-cluster compactness. Between-cluster sum of squares measures separation between clusters, not within-cluster variability. The silhouette coefficient for each cluster is not a standard direct output of PROC HPCLUS. The cophenetic correlation coefficient is a hierarchical clustering metric, not applicable to k-means.