
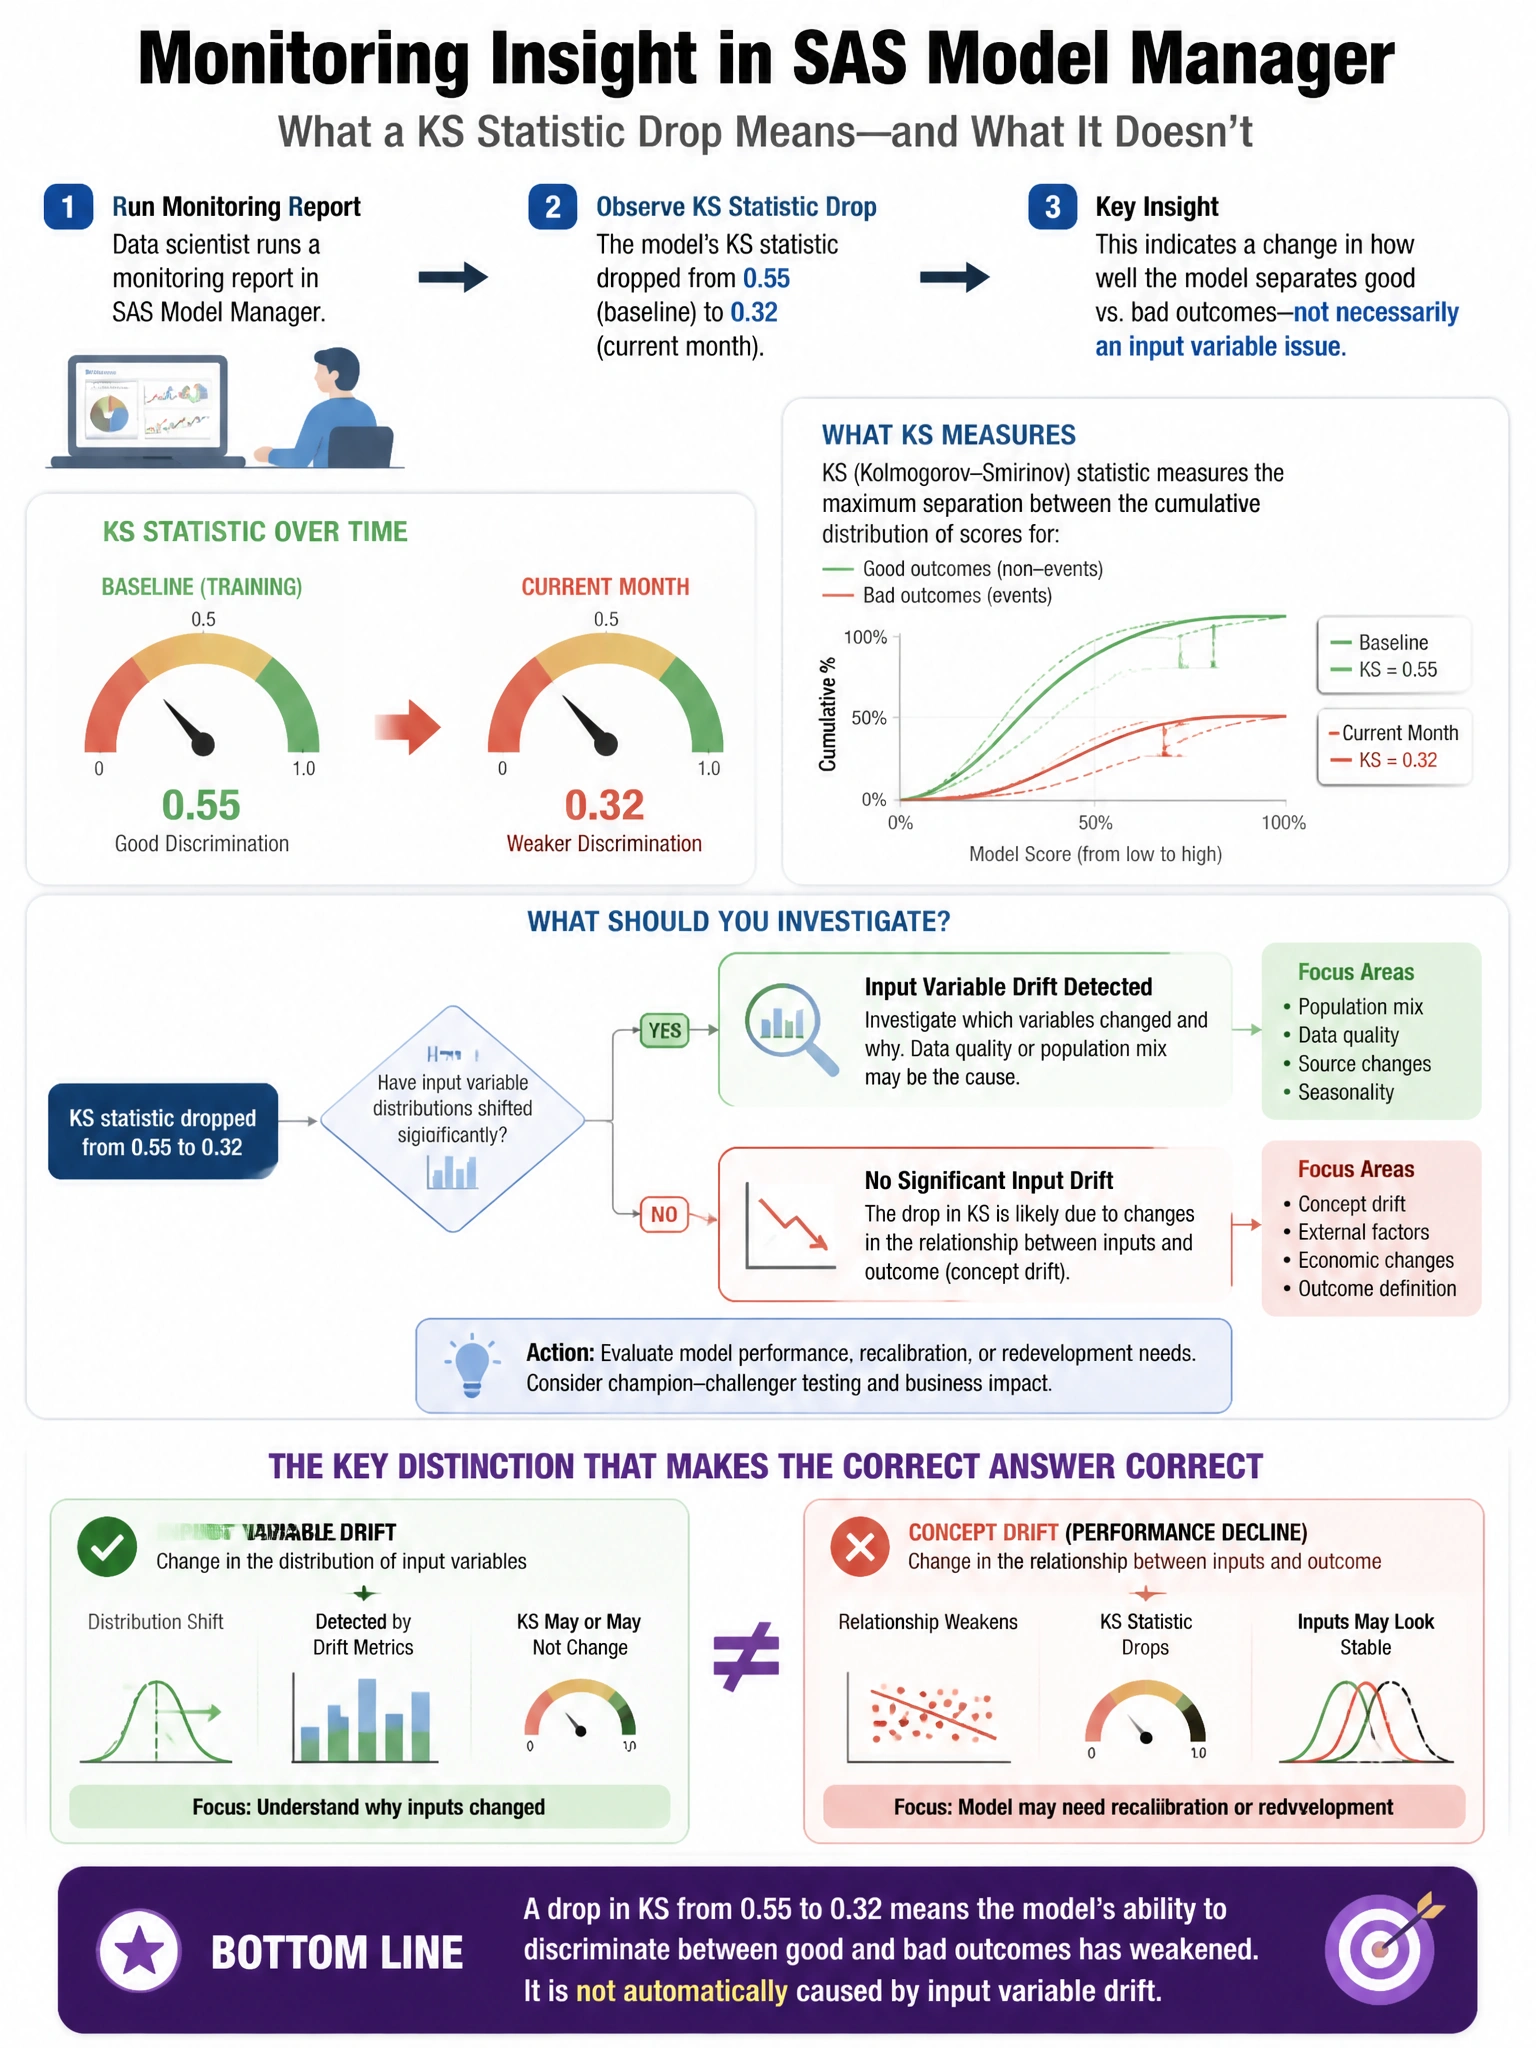
In SAS Model Manager, a data scientist runs a monitoring report and observes that the model's KS statistic dropped from 0.55 (baseline) to 0.32 (current month). The input variable PSI values are all below 0.10. What type of drift does this pattern most likely indicate?
Select an answer to reveal the explanation.
Short Explanation and Infographic
Here's the deal — b is correct because the combination of significant KS decline (performance degradation) with stable input PSI values (all < 0.10, indicating no data drift) is the hallmark of concept drift — the statistical relationship between the predictors and the outcome has changed while the input distributions remain the same. For example, economic conditions may have changed how credit utilization relates to default probability.
Full explanation below image
Full Explanation
B is correct because the combination of significant KS decline (performance degradation) with stable input PSI values (all < 0.10, indicating no data drift) is the hallmark of concept drift — the statistical relationship between the predictors and the outcome has changed while the input distributions remain the same. For example, economic conditions may have changed how credit utilization relates to default probability. A is wrong because PSI < 0.10 means input distributions are stable. C and D are possible but represent less likely explanations than the pattern clearly pointing to concept drift.