
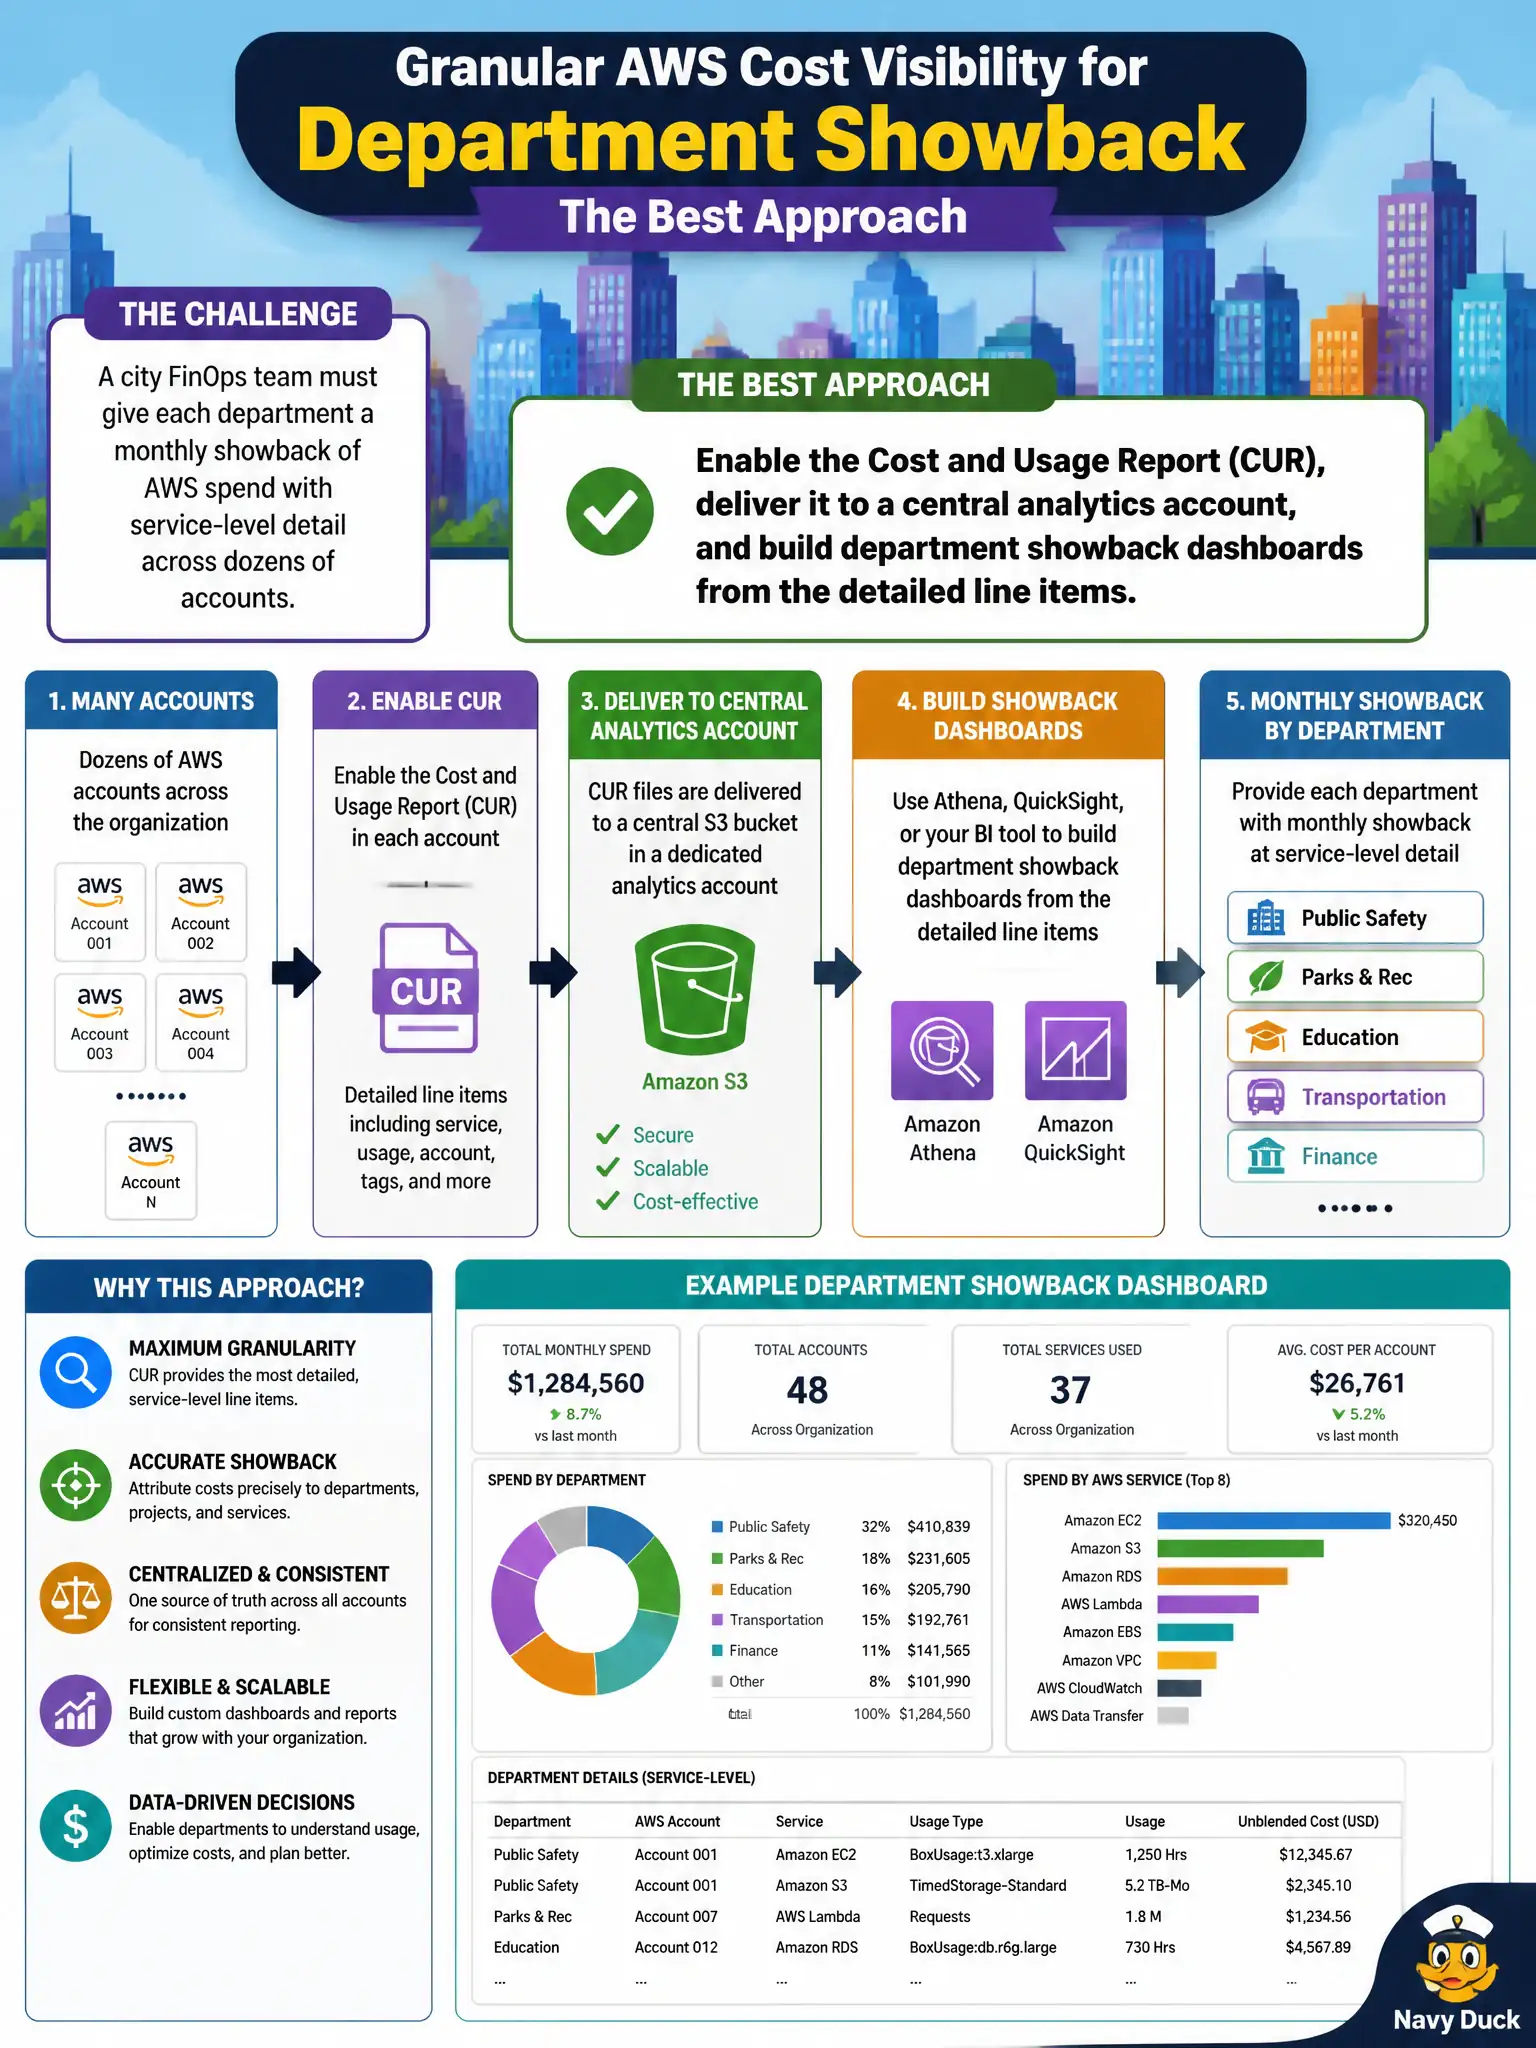
A city FinOps team must give each department a monthly showback of AWS spend with service-level detail across dozens of accounts. Which approach best provides that granular organizational cost visibility?
Select an answer to reveal the explanation.
Short Explanation
Showback needs a spreadsheet of truth, not a one-page invoice. CUR dumps every line item into a central analytics lane so parks, courts, and utilities each see their own meter. Averaging by headcount hides the real spenders.
Full Explanation
Departmental showback across a multi-account municipal estate requires line-item cost and usage data that can be joined to organizational tags, account mappings, and service dimensions. The AWS Cost and Usage Report is the canonical export for that depth: enable CUR, deliver the files to a central analytics account, and build Athena or BI dashboards so parks, courts, utilities, and other departments each see their own meter at service-level grain. Centralizing the landing zone keeps finance and FinOps ownership clear while application accounts remain producers of tagged usage rather than ad-hoc report silos. A monthly payer-account invoice PDF summarizes charges for payment but does not provide the exportable, queryable detail needed for fair department allocation or service-level trends. Disabling Cost Explorer APIs organization-wide removes visibility instead of enabling governed transparency, which undermines both showback and anomaly detection. Averaging an untagged shared account by headcount alone obscures heavy consumers and cannot attribute spend to the civic workloads that actually drove it. Exam caveat: CUR is necessary but not sufficient—without consistent cost allocation tags and an account-to-department map, dashboards stay noisy. Operational check: confirm the latest CUR partition lands on schedule, sample a department filter for expected services, and reconcile a known large account against Cost Explorer before publishing the monthly pack.