
Citizen check-in latency spikes while overall DynamoDB table metrics look only moderately busy. How should performance monitoring help?
Select an answer to reveal the explanation.
Short Explanation
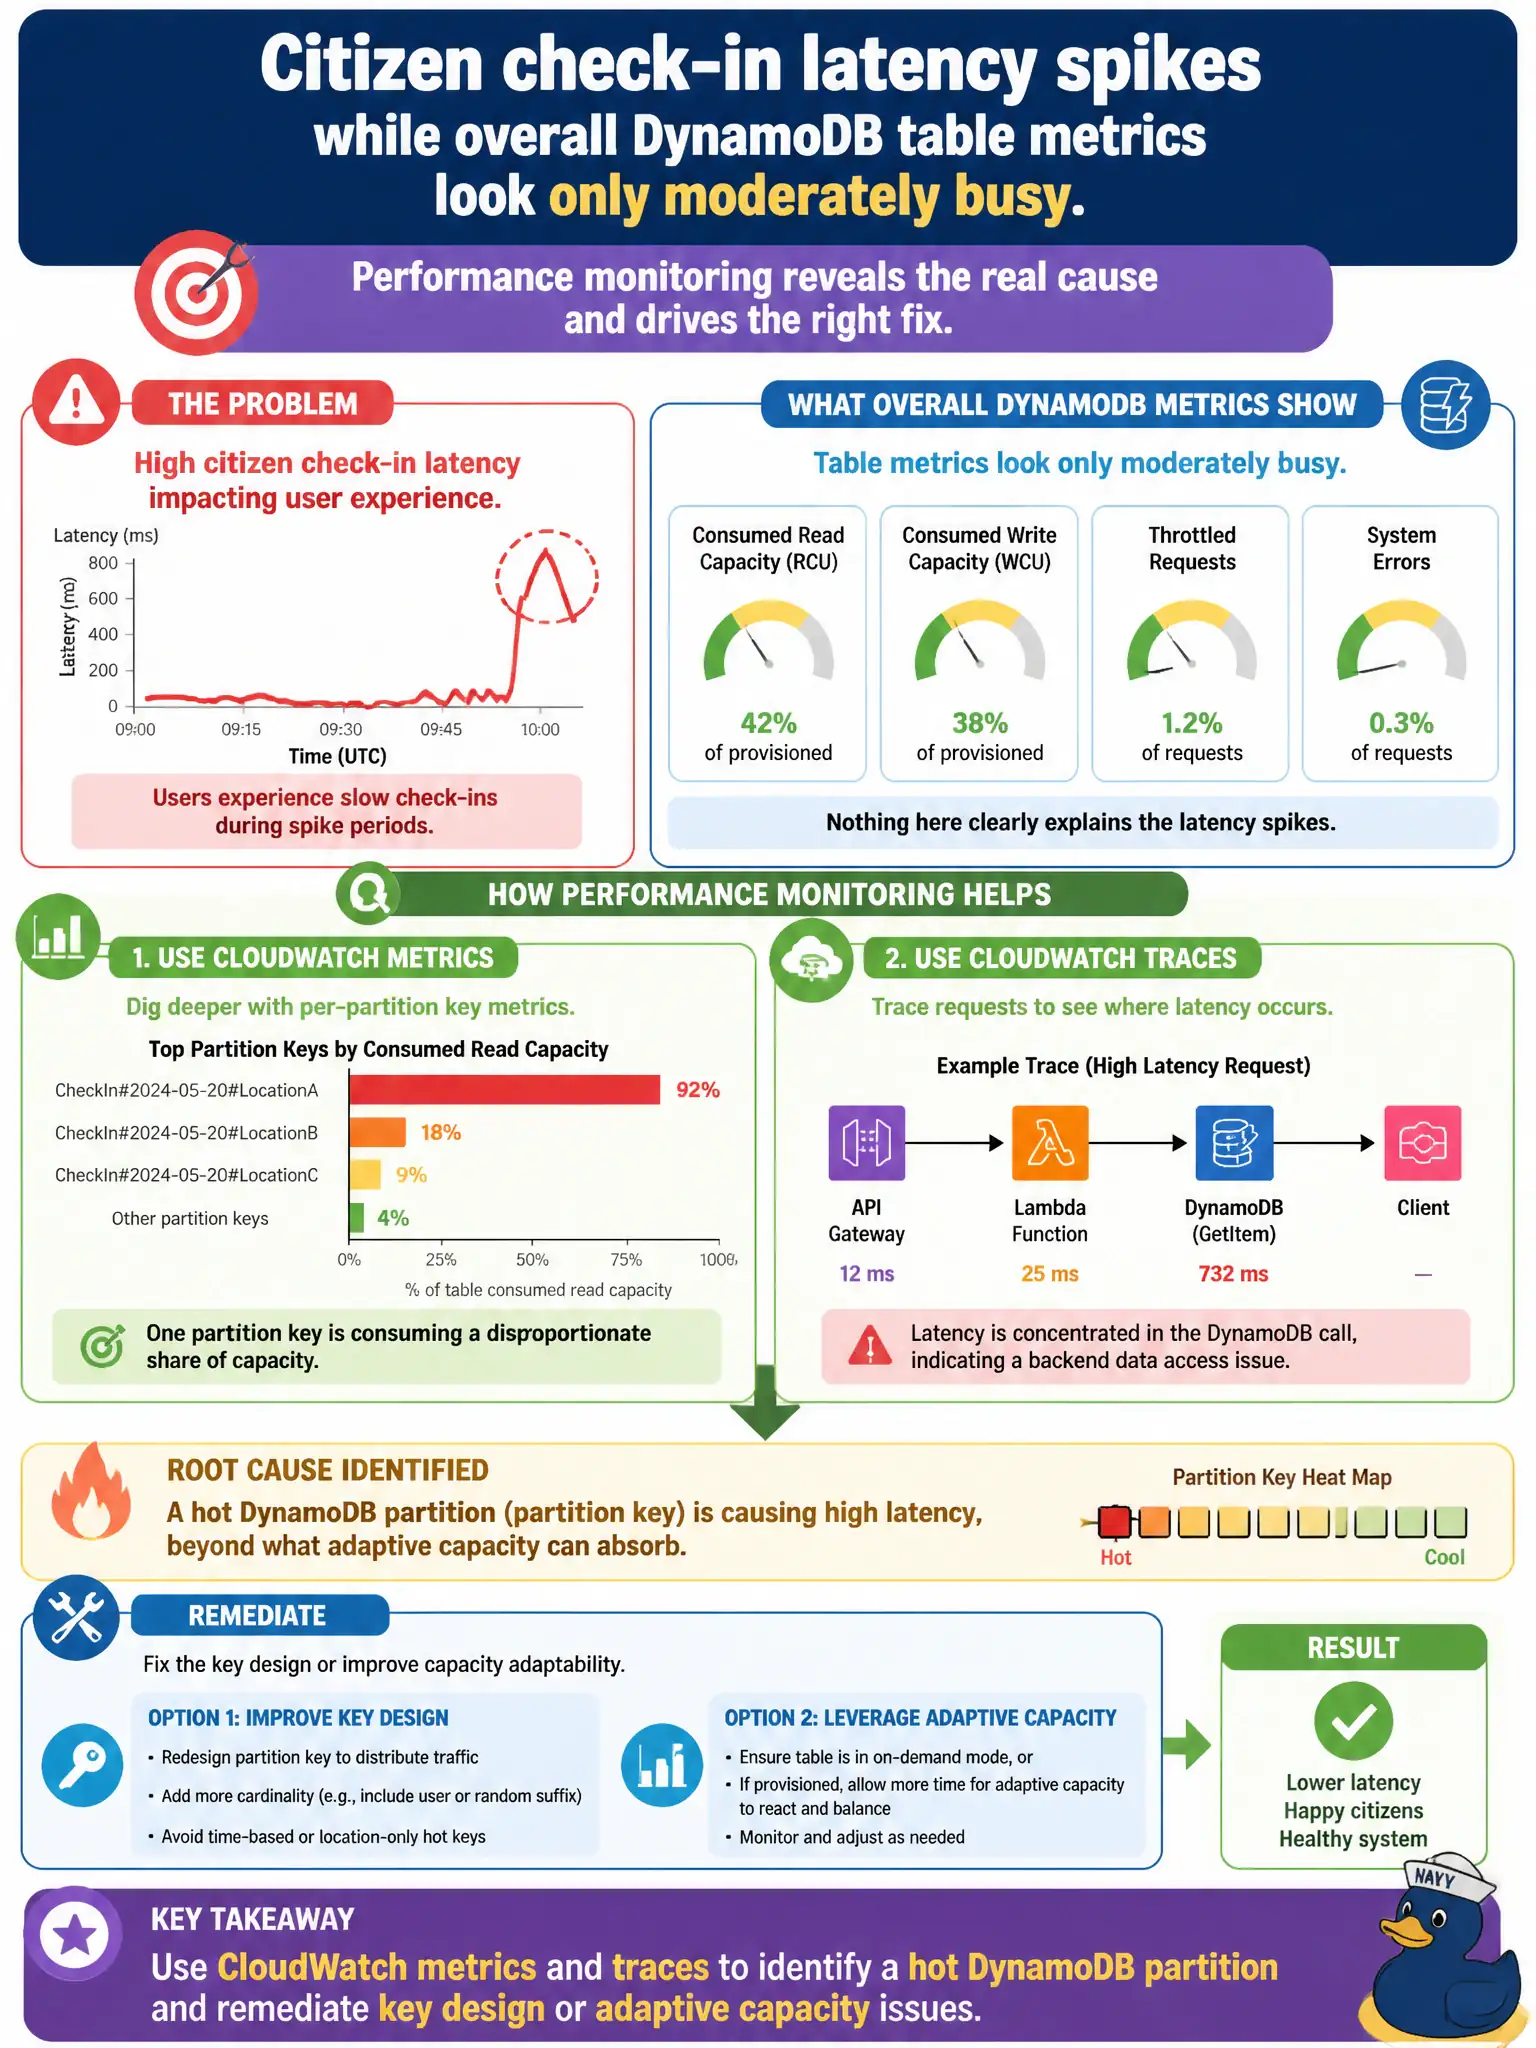
Average table health can hide one red-hot partition key. CloudWatch metrics and traces help you find that hotspot in the check-in path and fix the key design.
Full Explanation
Citizen check-in latency can spike from a hot DynamoDB partition even when overall table metrics look only moderately busy. CloudWatch metrics and traces—including partition-level insights where enabled—help identify the hot key design and guide remediation via key redesign or adaptive capacity. Ignoring CloudWatch and throttling users randomly hides the diagnosis. Deleting and recreating the table nightly without investigating partition behavior risks data loss and downtime without fixing the access pattern. Disabling Contributor Insights and detailed metrics during the incident reduces visibility when it is most needed. Exam caveat: adaptive capacity helps but is not a substitute for low-cardinality partition keys on citizen-id patterns. Operational check: enable partition-aware metrics, reproduce the hot key in a load test, redesign the key or write sharding, and confirm p99 check-in latency recovers under the same load. In municipal cloud governance, record the owners, success metrics, and rollback or restore contacts beside this technical choice so the next incident, budget review, or audit does not rediscover the decision from scratch under time pressure. In municipal cloud governance, record the owners, success metrics, and rollback or restore contacts beside this technical choice so the next incident, budget review, or audit does not rediscover the decision from scratch under time pressure.