
After several performance remediations, a city digital-services team still only watches server CPU and 5xx rates. Citizens report intermittent slow page loads that operations never sees. Which monitoring toolset change best sustains the performance improvements?
Select an answer to reveal the explanation.
Short Explanation
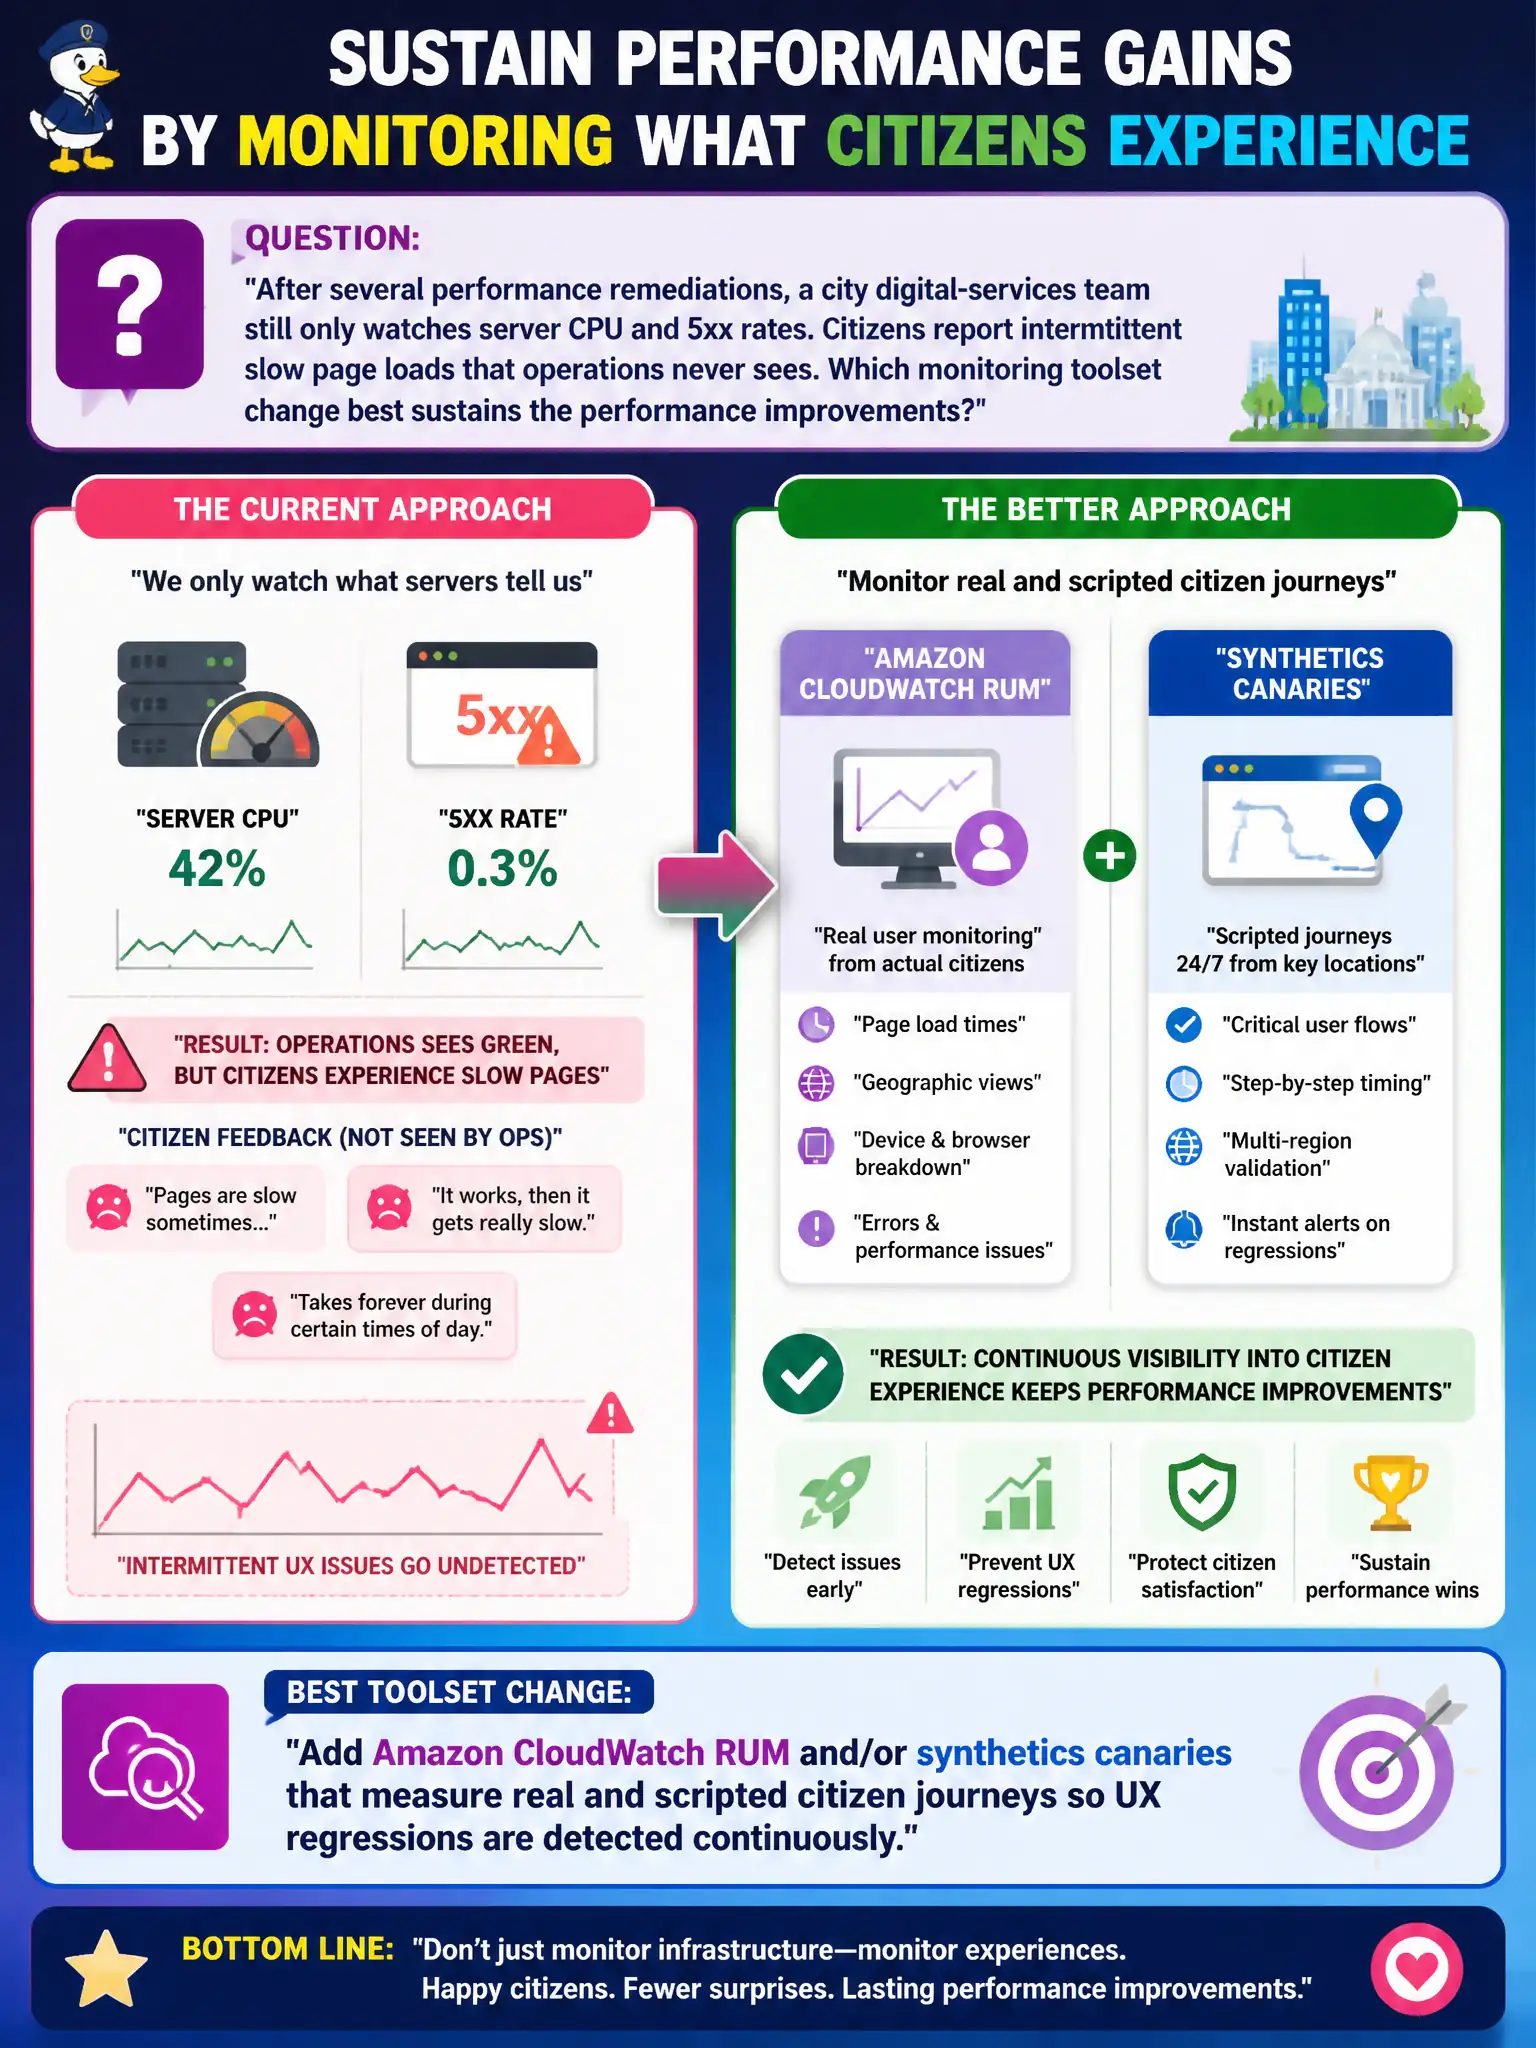
Server green lights do not equal happy citizens staring at a spinner on their phones. RUM and synthetics watch the actual journey—like mystery shoppers for the website—so UX regressions show up before the mayor’s office hears about them.
Full Explanation
After performance remediations, watching only server CPU and 5xx rates still misses intermittent slow page loads that citizens report but operations never sees. Adding Amazon CloudWatch RUM and/or synthetics canaries that measure real and scripted citizen journeys detects UX regressions continuously and sustains the performance improvements. That monitoring toolset change works because server metrics omit browser, network last-mile, and client-side render problems common on municipal sites. Relying solely on weekly manual browser checks from one office desktop fails geographic and continuous coverage. Turning off application logs to reduce noise around latency spikes fails by discarding forensic detail. Monitoring only EC2 status checks fails conceptually—status checks do not include browser render time. Exam caveat: synthetics should script critical journeys with assertions on timing budgets; RUM needs privacy review for end-user data collection in civic contexts. Operational check: deploy a canary for the top citizen journey and RUM on the portal, alert when p95 exceeds the UX SLO, correlate with a known slow release in staging, and keep CPU/5xx as complementary—not sole—signals.