
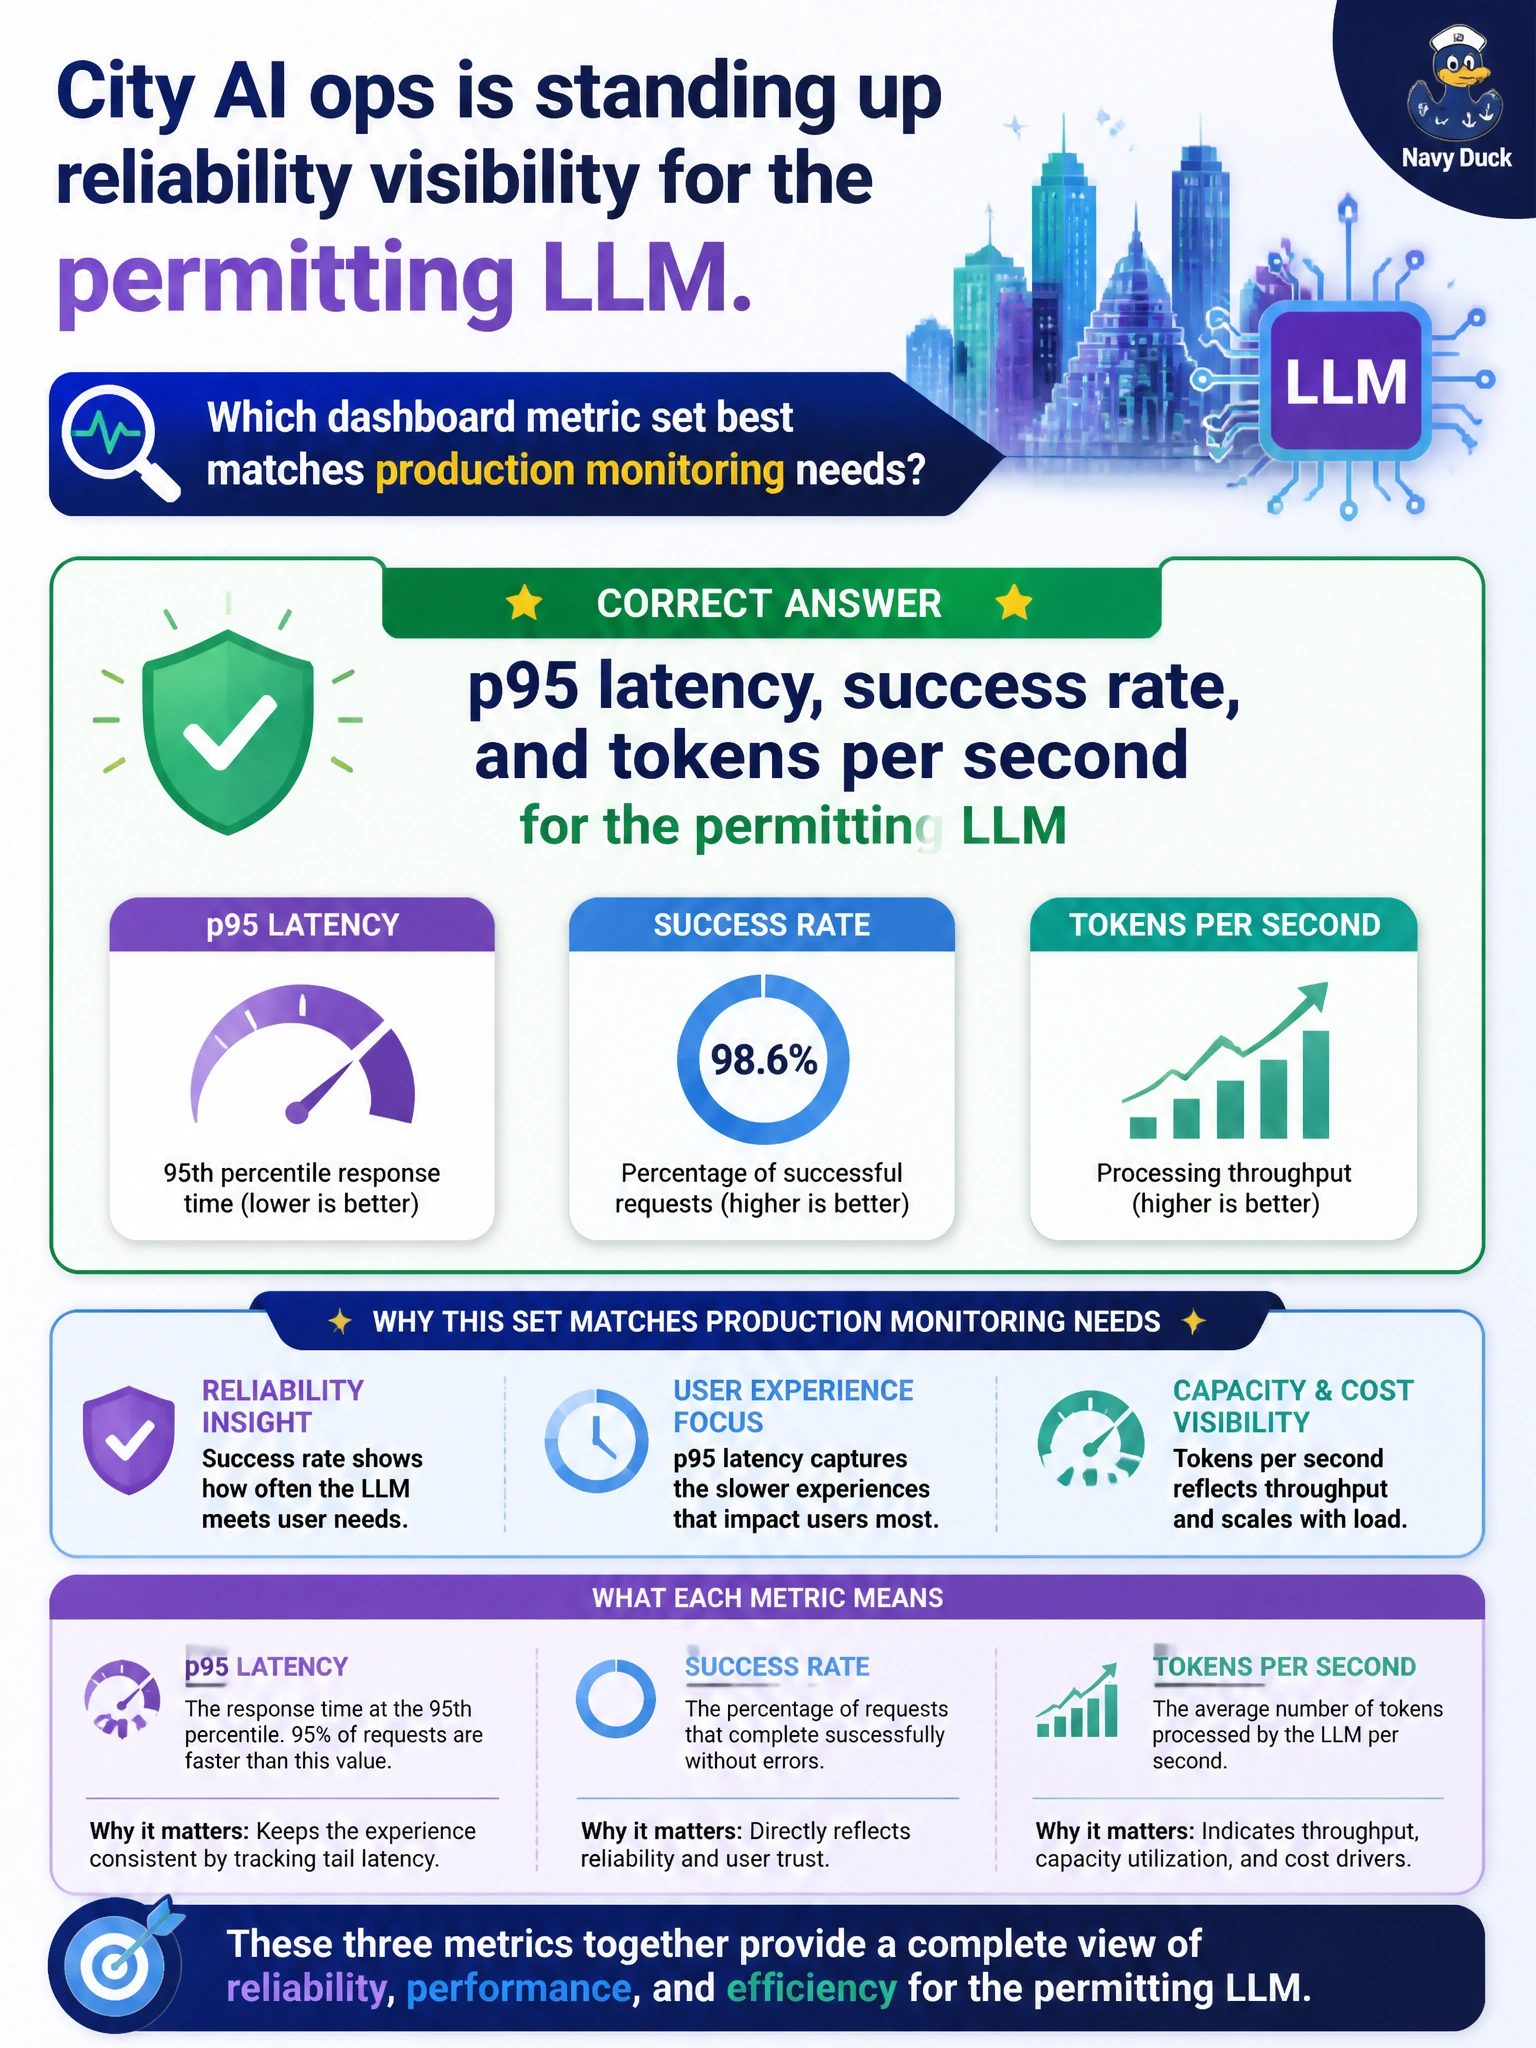
City AI ops is standing up reliability visibility for the permitting LLM. Which dashboard metric set best matches production monitoring needs?
Select an answer to reveal the explanation.
Short Explanation
A permitting bot dashboard should feel like a transit ops board: how fast answers land, how often they succeed, and how hard the GPUs are chewing tokens. Fan noise and homepage clicks do not tell you if residents are waiting.
Full Explanation
City AI ops standing up reliability visibility for a permitting LLM needs dashboard metrics that reflect resident-facing serving health, not facilities or marketing noise. p95 latency, success rate, and tokens per second form a coherent production triad: latency shows how long permit applicants wait for answers, success rate shows whether requests complete without 5xx or empty failures, and tokens per second shows whether GPU serving throughput matches demand. Together they tell ops whether the permitting assistant is fast enough, reliable enough, and capacity-healthy under civic load. Only GPU fan RPM and rack temperature with no request-level signals describe hardware comfort, not whether residents receive usable permit guidance. Marketing click-through rates on the permit website homepage alone measure acquisition interest, not LLM correctness or serving SLOs. Annual budget burn with no live serving telemetry is a finance artifact; it cannot alert when the permitting model stalls midday. Exam caveat: infrastructure metrics still matter for capacity planning, but they complement—not replace—request-level GenAI signals; also prefer percentiles (p95/p99) over averages that hide tail pain for permit applicants. Operational check: instrument each permitting inference with latency histograms, success/failure labels, and token counters; place those three panels on the primary ops board; alert when p95 or success rate breaches SLO; and correlate token throughput with GPU utilization only after request health is green.