
The 311 assistant runs on a Kubernetes serving mesh. What live monitoring should ops implement with serving?
Select an answer to reveal the explanation.
Short Explanation
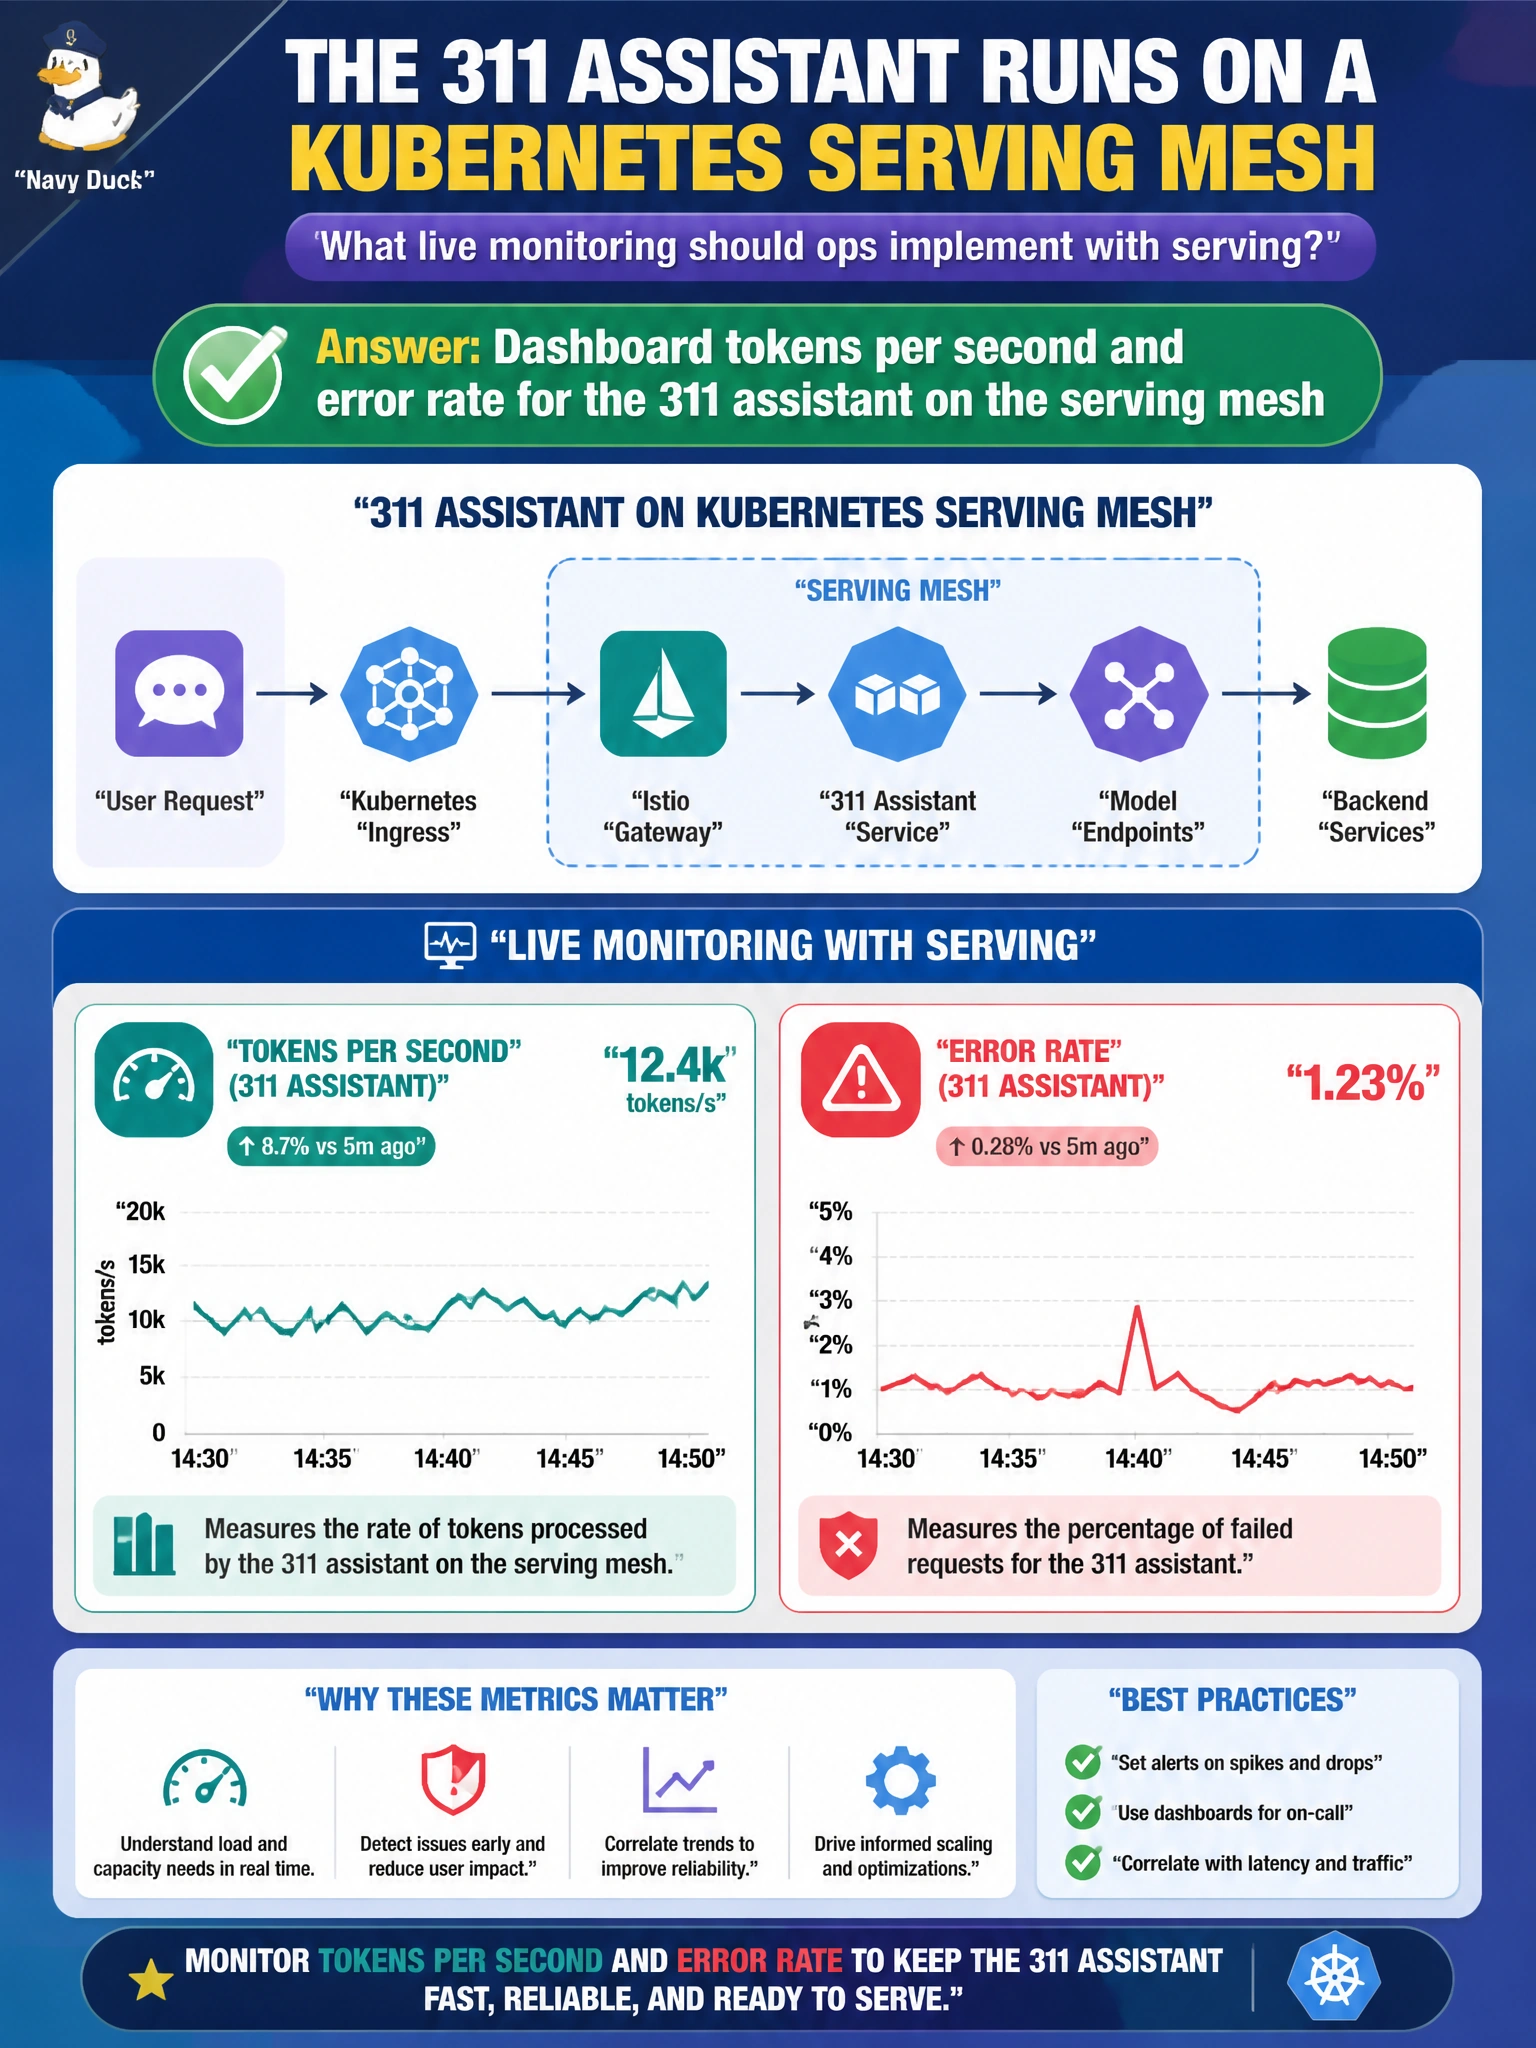
If the 311 assistant is coughing, you want tokens-per-second and error rate on the dashboard—not coffee-machine jokes. Wire live metrics into the serving mesh so ops sees trouble while residents are still on the line.
Full Explanation
A 311 assistant on a Kubernetes serving mesh needs live serving metrics that reflect LLM health: dashboard tokens per second and error rate, alongside latency SLOs, so ops can detect saturation, bad deploys, or backend faults while residents are still calling. Tracking only wallpaper slideshow uptime on lobby displays says nothing about assistant correctness or throughput during an outage. Monitoring solely coffee-machine faults in city hall is unrelated facility telemetry that will not page the on-call engineer for a model failure. Disabling metrics scrapes so dashboards stay empty during incidents removes the very signals needed for incident response and detailed postmortems. Exam caveat: tokens per second without request error rate or p95 can look healthy while users receive failures or truncated answers—alert on a balanced set of golden signals tied to the mesh deploy and release channel. Operational check: scrape tokens per second, error rate, and end-to-end latency from the 311 deployment on the serving mesh, run a controlled fault such as a bad model replica or injected server errors, and verify dashboards and alerts fire before rolling back via the mesh release process path.