
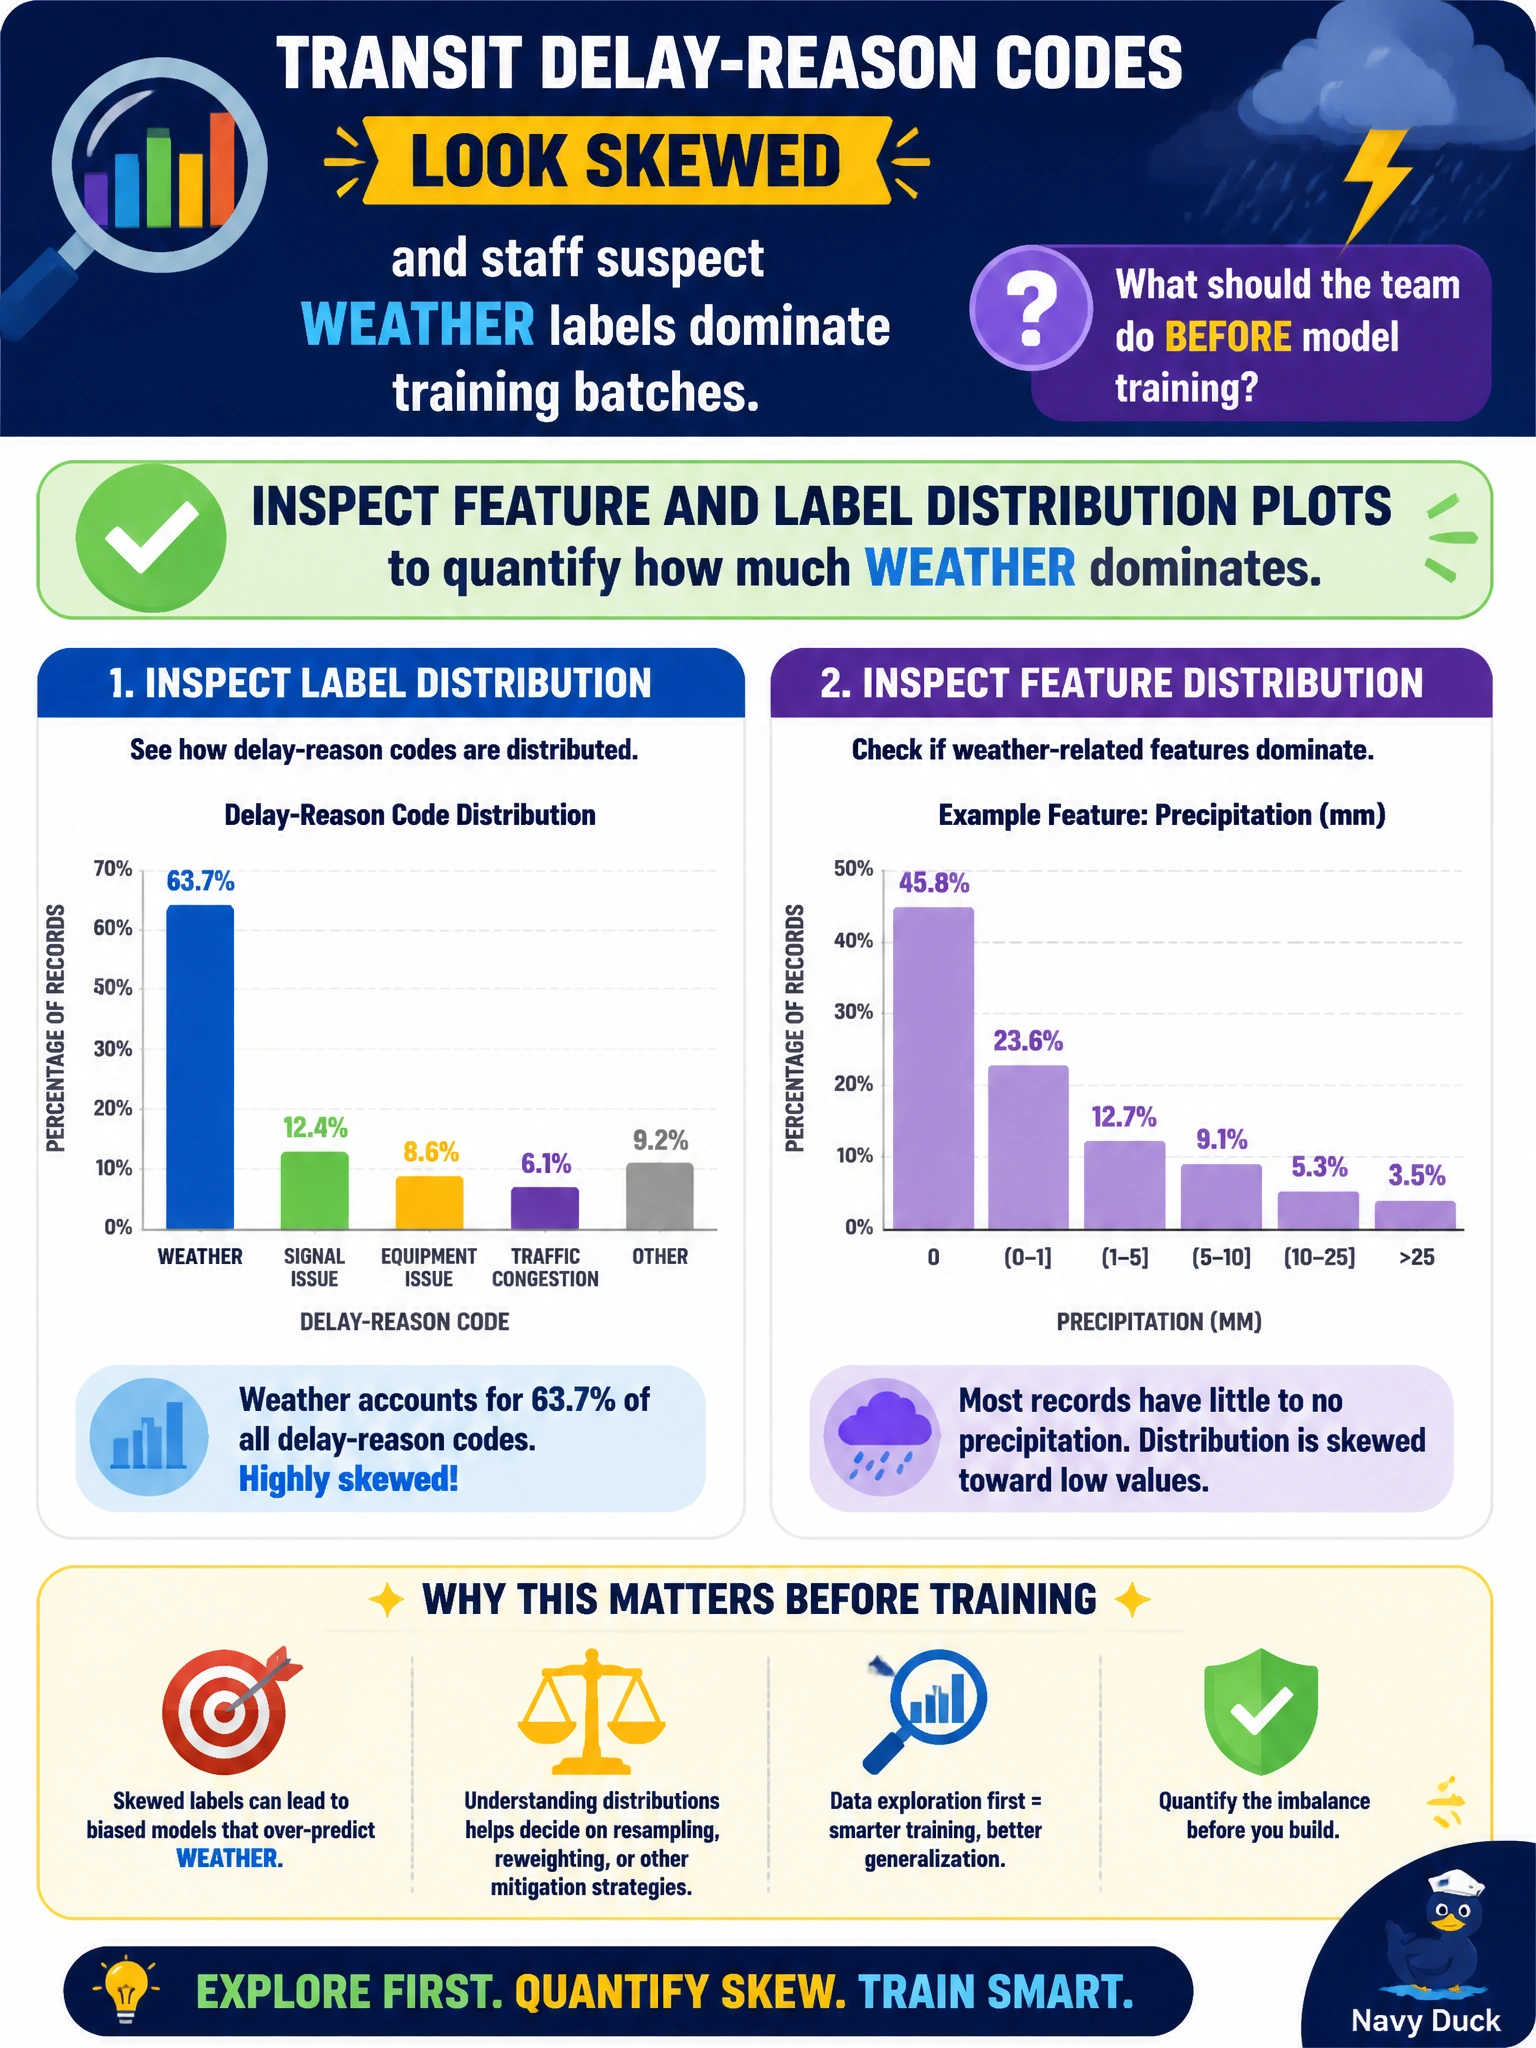
Transit delay-reason codes look skewed, and staff suspect weather labels dominate training batches. What should the team do before model training?
Select an answer to reveal the explanation.
Short Explanation
If you think weather is eating the batch, don’t guess—look at the charts. Plot the delay-reason distribution before you train so the skew is visible.
Full Explanation
Before training on transit delay-reason codes that look skewed, the team should inspect feature and label distribution plots to quantify how much weather dominates. Distribution analysis is the diagnostic step that turns a suspicion into measured imbalance and informs whether to rebalance, stratify splits, or revise labeling. Skipping this inspection leaves curation guesses ungrounded. Assuming uniform class balance and proceeding without plots ignores the suspected weather dominance and risks training a weather-biased delay model. Hiding the weather label so the imbalance cannot be measured obstructs diagnosis and does not remove the underlying skew in the remaining data. Upsampling weather again until it is the only reason code remaining amplifies the dominant class to a monopoly and destroys the multi-cause delay taxonomy the agency needs. Exam caveat: plots reveal skew but do not dictate a single remedy—after quantifying weather share, choose undersampling, stratified batching, or class weights based on operational cost of missing rare non-weather causes. Operational check: produce label histograms and key feature plots on the delay corpus, record weather's share in the datasheet, and gate model training on a completed distribution review with an explicit rebalancing decision.