
Water utility HPL burn-in shows progressive score decay over successive hours. What does that signal?
Select an answer to reveal the explanation.
Short Explanation
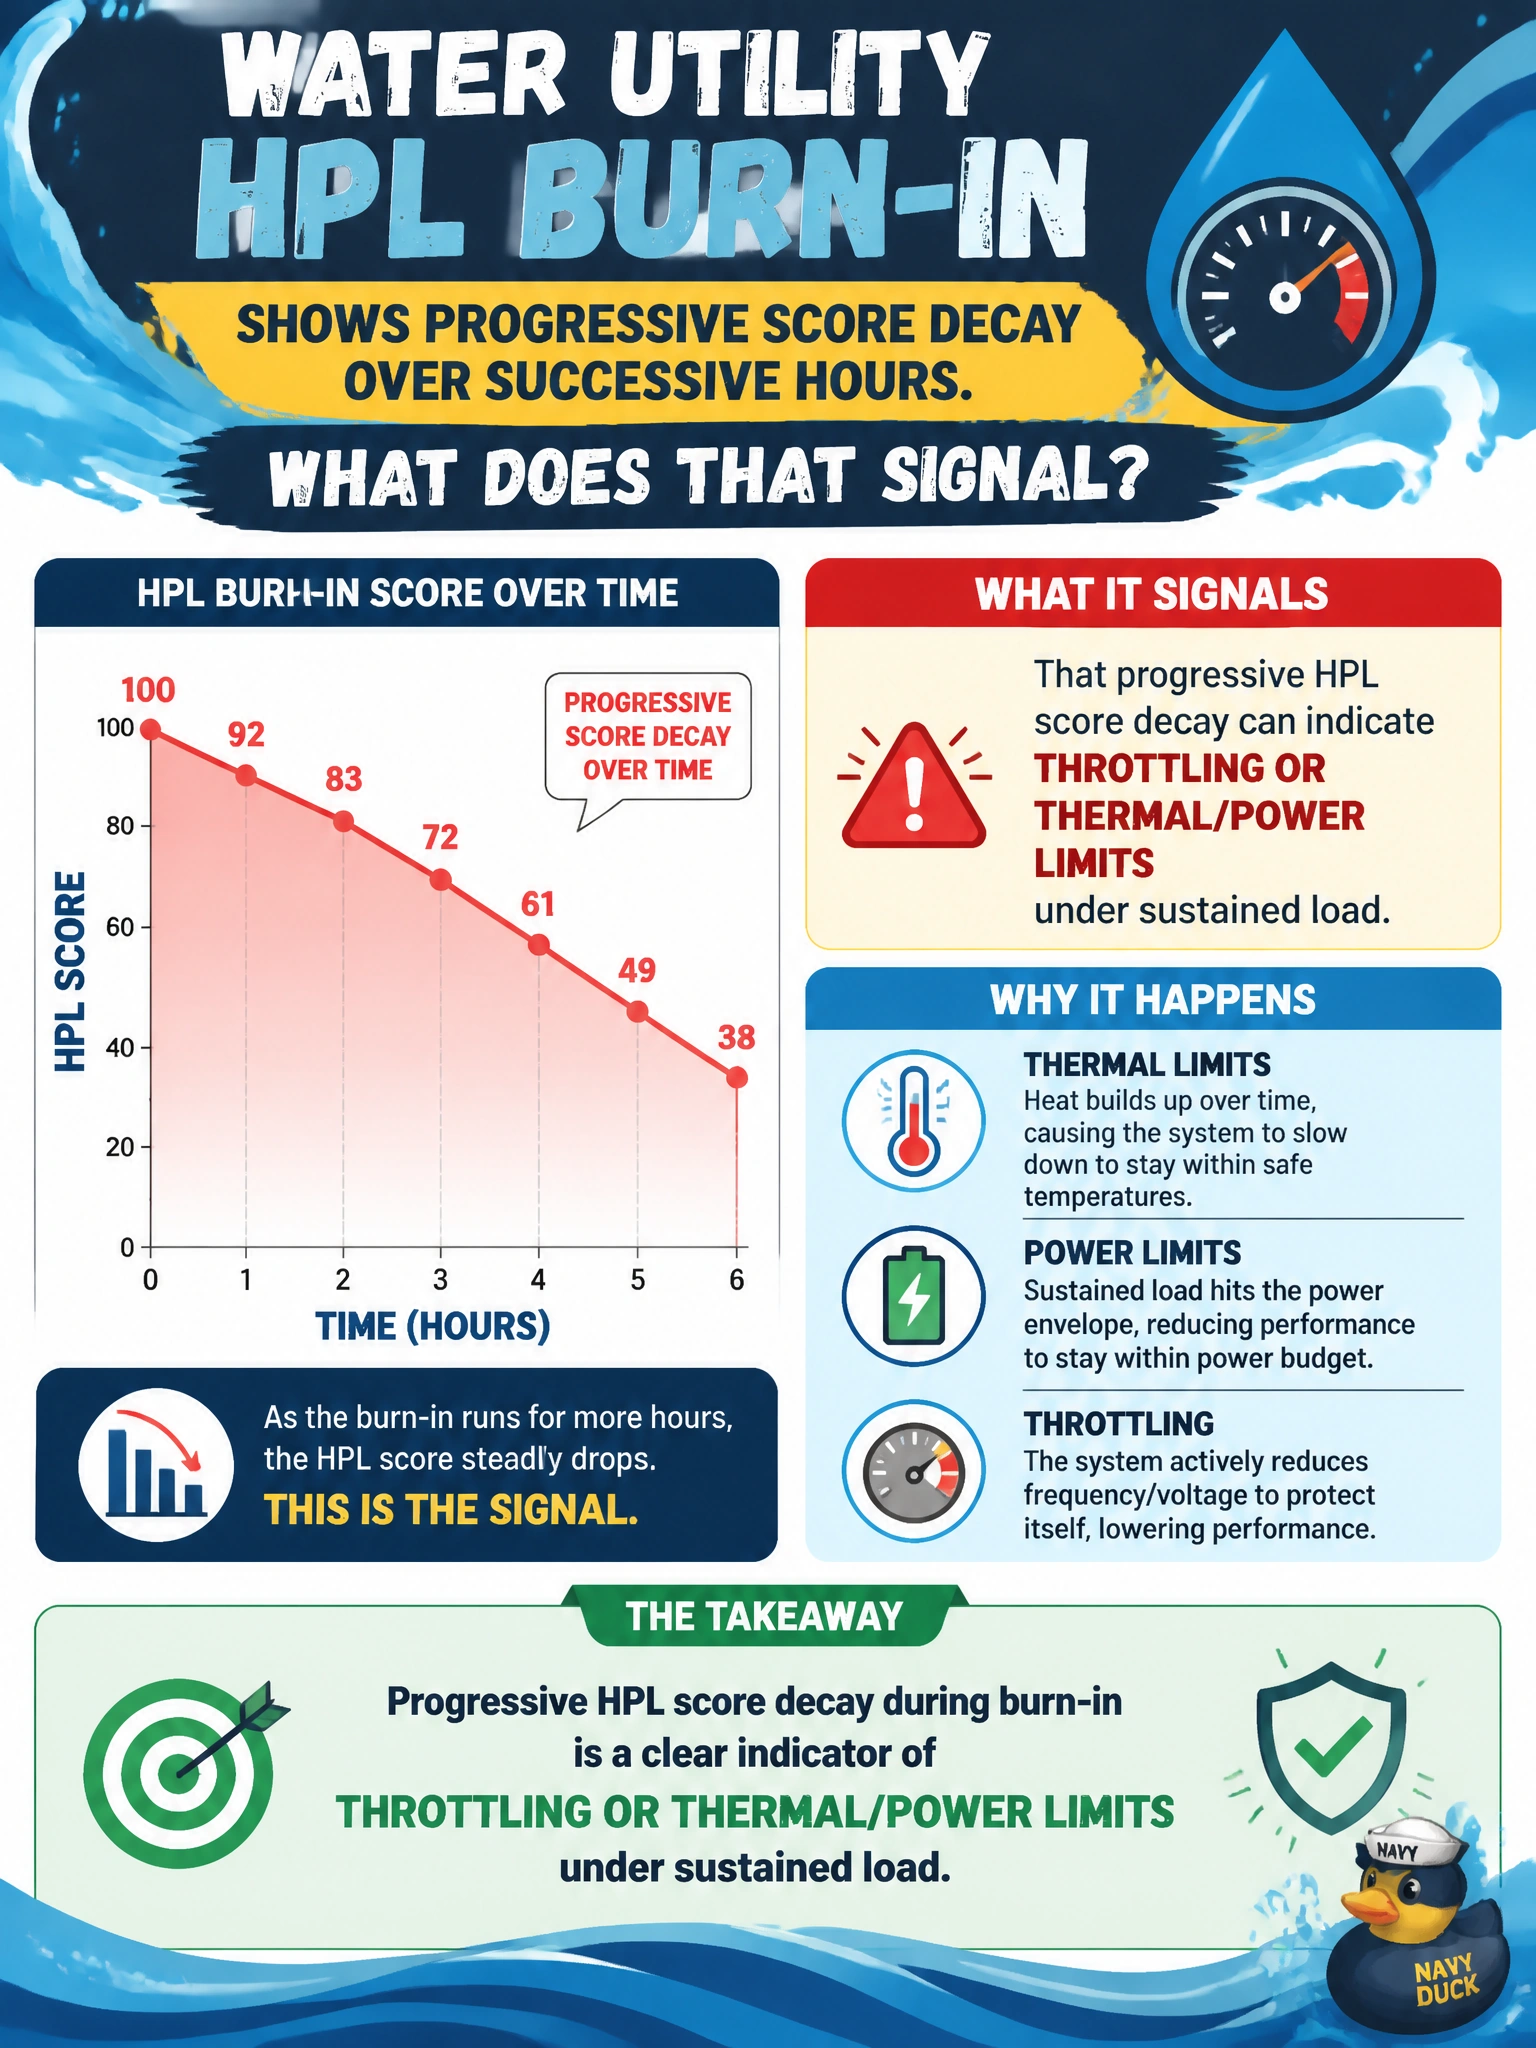
When you see HPL scores gradually fall during water-utility burn-in, you’re right to investigate throttling or thermal and power limits under sustained load. Don’t dismiss the trend by averaging scores, blaming the benchmark binary automatically, or assuming it proves an NFS problem.
Full Explanation
Progressive HPL score decay over successive hours of water-utility burn-in can signal throttling or thermal/power limits under sustained load, so you should treat it as a hardware or environmental finding. Healthy nodes should sustain policy-level Linpack performance across the burn-in window; a gradual decline may mean cooling, power delivery, or device limits are constraining performance as heat accumulates. The claim that decay always means the benchmark binary is outdated is too absolute: a packaging problem is possible, but the score trend alone does not establish it. Averaging early and late scores and ignoring the trend hides the evidence that distinguishes sustained performance from degradation. Score decay also does not prove storage NFS is misconfigured only; HPL primarily stresses compute, and an NFS diagnosis requires separate evidence. Exam caveat: scores alone do not identify the precise limit, so compare them with clock, power, and thermal telemetry; rising temperatures or recorded power-limit events support a throttling diagnosis. Practical check: plot HPL score against time alongside GPU thermals and power-limit events, investigate nodes with progressive decay, address cooling, power, or hardware constraints, and repeat burn-in before returning affected capacity to service.