
Ops must watch the live 311 agent’s health beyond “is the pod up?” Which dashboard definition best fits?
Select an answer to reveal the explanation.
Short Explanation
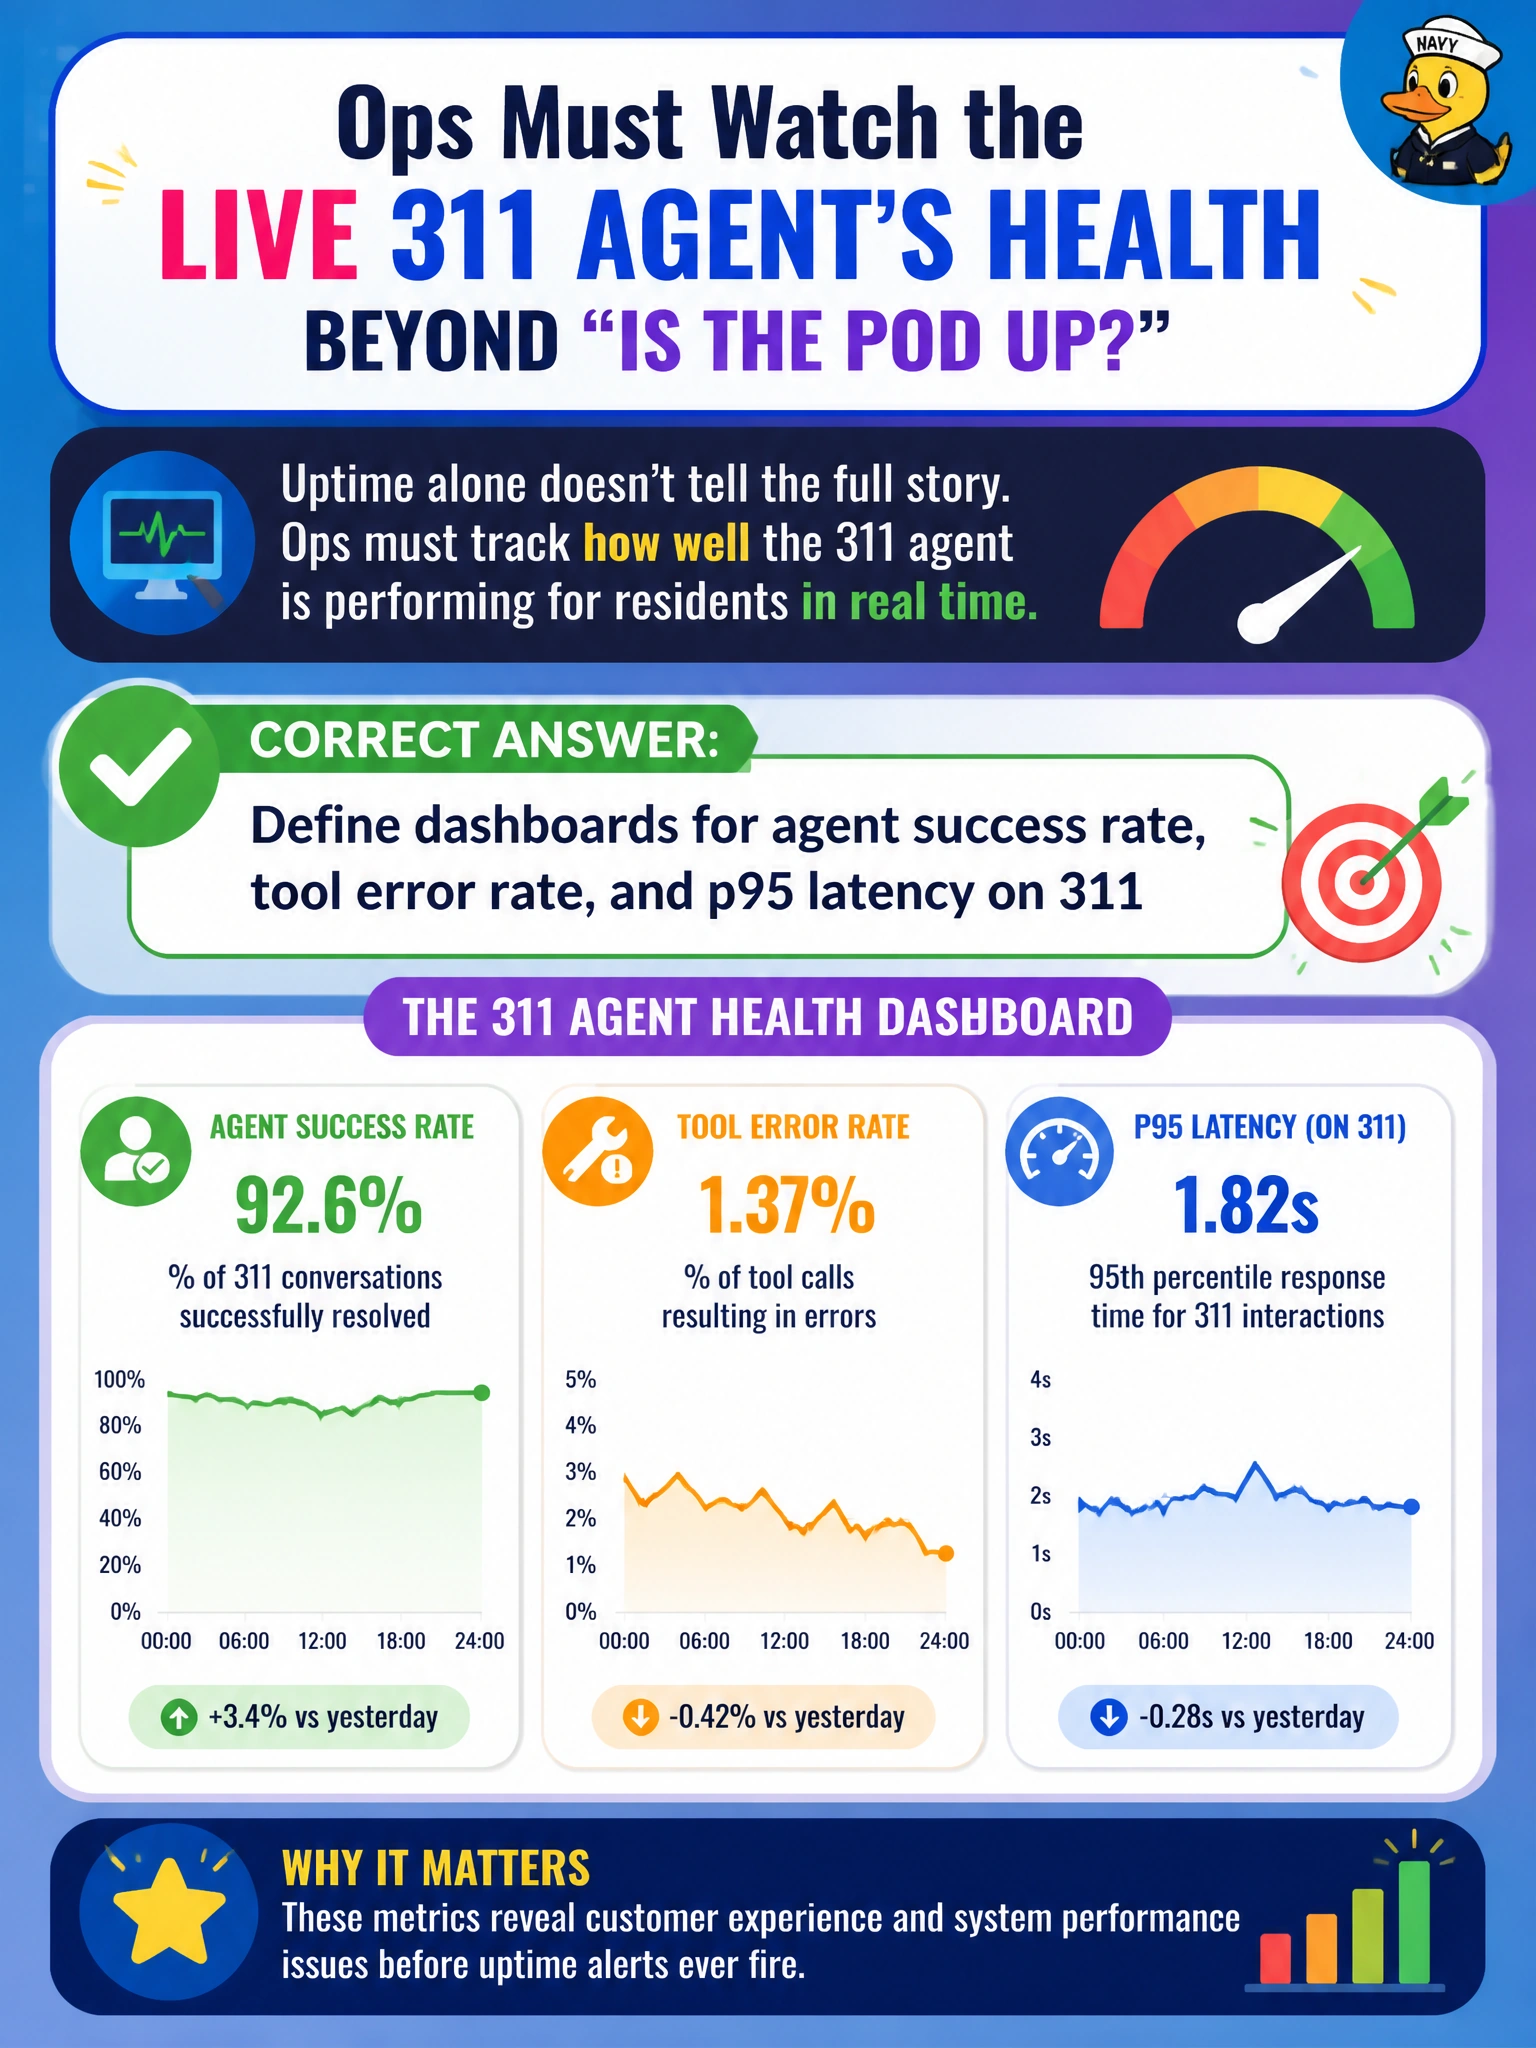
Pods can be green while answers are garbage. Dashboards for success rate, tool errors, and p95 latency tell ops how the live 311 agent is really doing.
Full Explanation
Operations must watch the live 311 agent’s health beyond “is the pod up?” The dashboard definition that fits tracks agent success rate, tool error rate, and p95 latency on 311. Those metrics speak to whether the civic agent completes tasks correctly, whether tools are failing in the path, and whether residents experience acceptable responsiveness—reliability properties infrastructure-only green lights do not capture.
Tracking only break-room coffee machine uptime as a proxy for AI health fails by irrelevance; coffee availability is not agent reliability. Monitoring CPU fan noise and ignoring agent task outcomes fails because hardware acoustics do not measure successful resolutions or correct refusals. Showing marketing page views and treating them as agent success fails because traffic to a webpage is not task success for a conversational municipal agent.
Exam caveat: success rate must be defined carefully—counting “any reply” as success hides hallucinations and unsafe completions. Pair outcome metrics with safety/refusal metrics so dashboards cannot look healthy while policy violations rise.
Operational check: wire golden-path 311 journeys into synthetic probes, chart success/tool-error/p95 on the ops dashboard with SLO burn alerts, and review weekly whether metric definitions still match the city’s definition of a completed resident request.