
Tail latency spikes when every municipal agent calls the same GIS service. What should profiling focus on first?
Select an answer to reveal the explanation.
Short Explanation
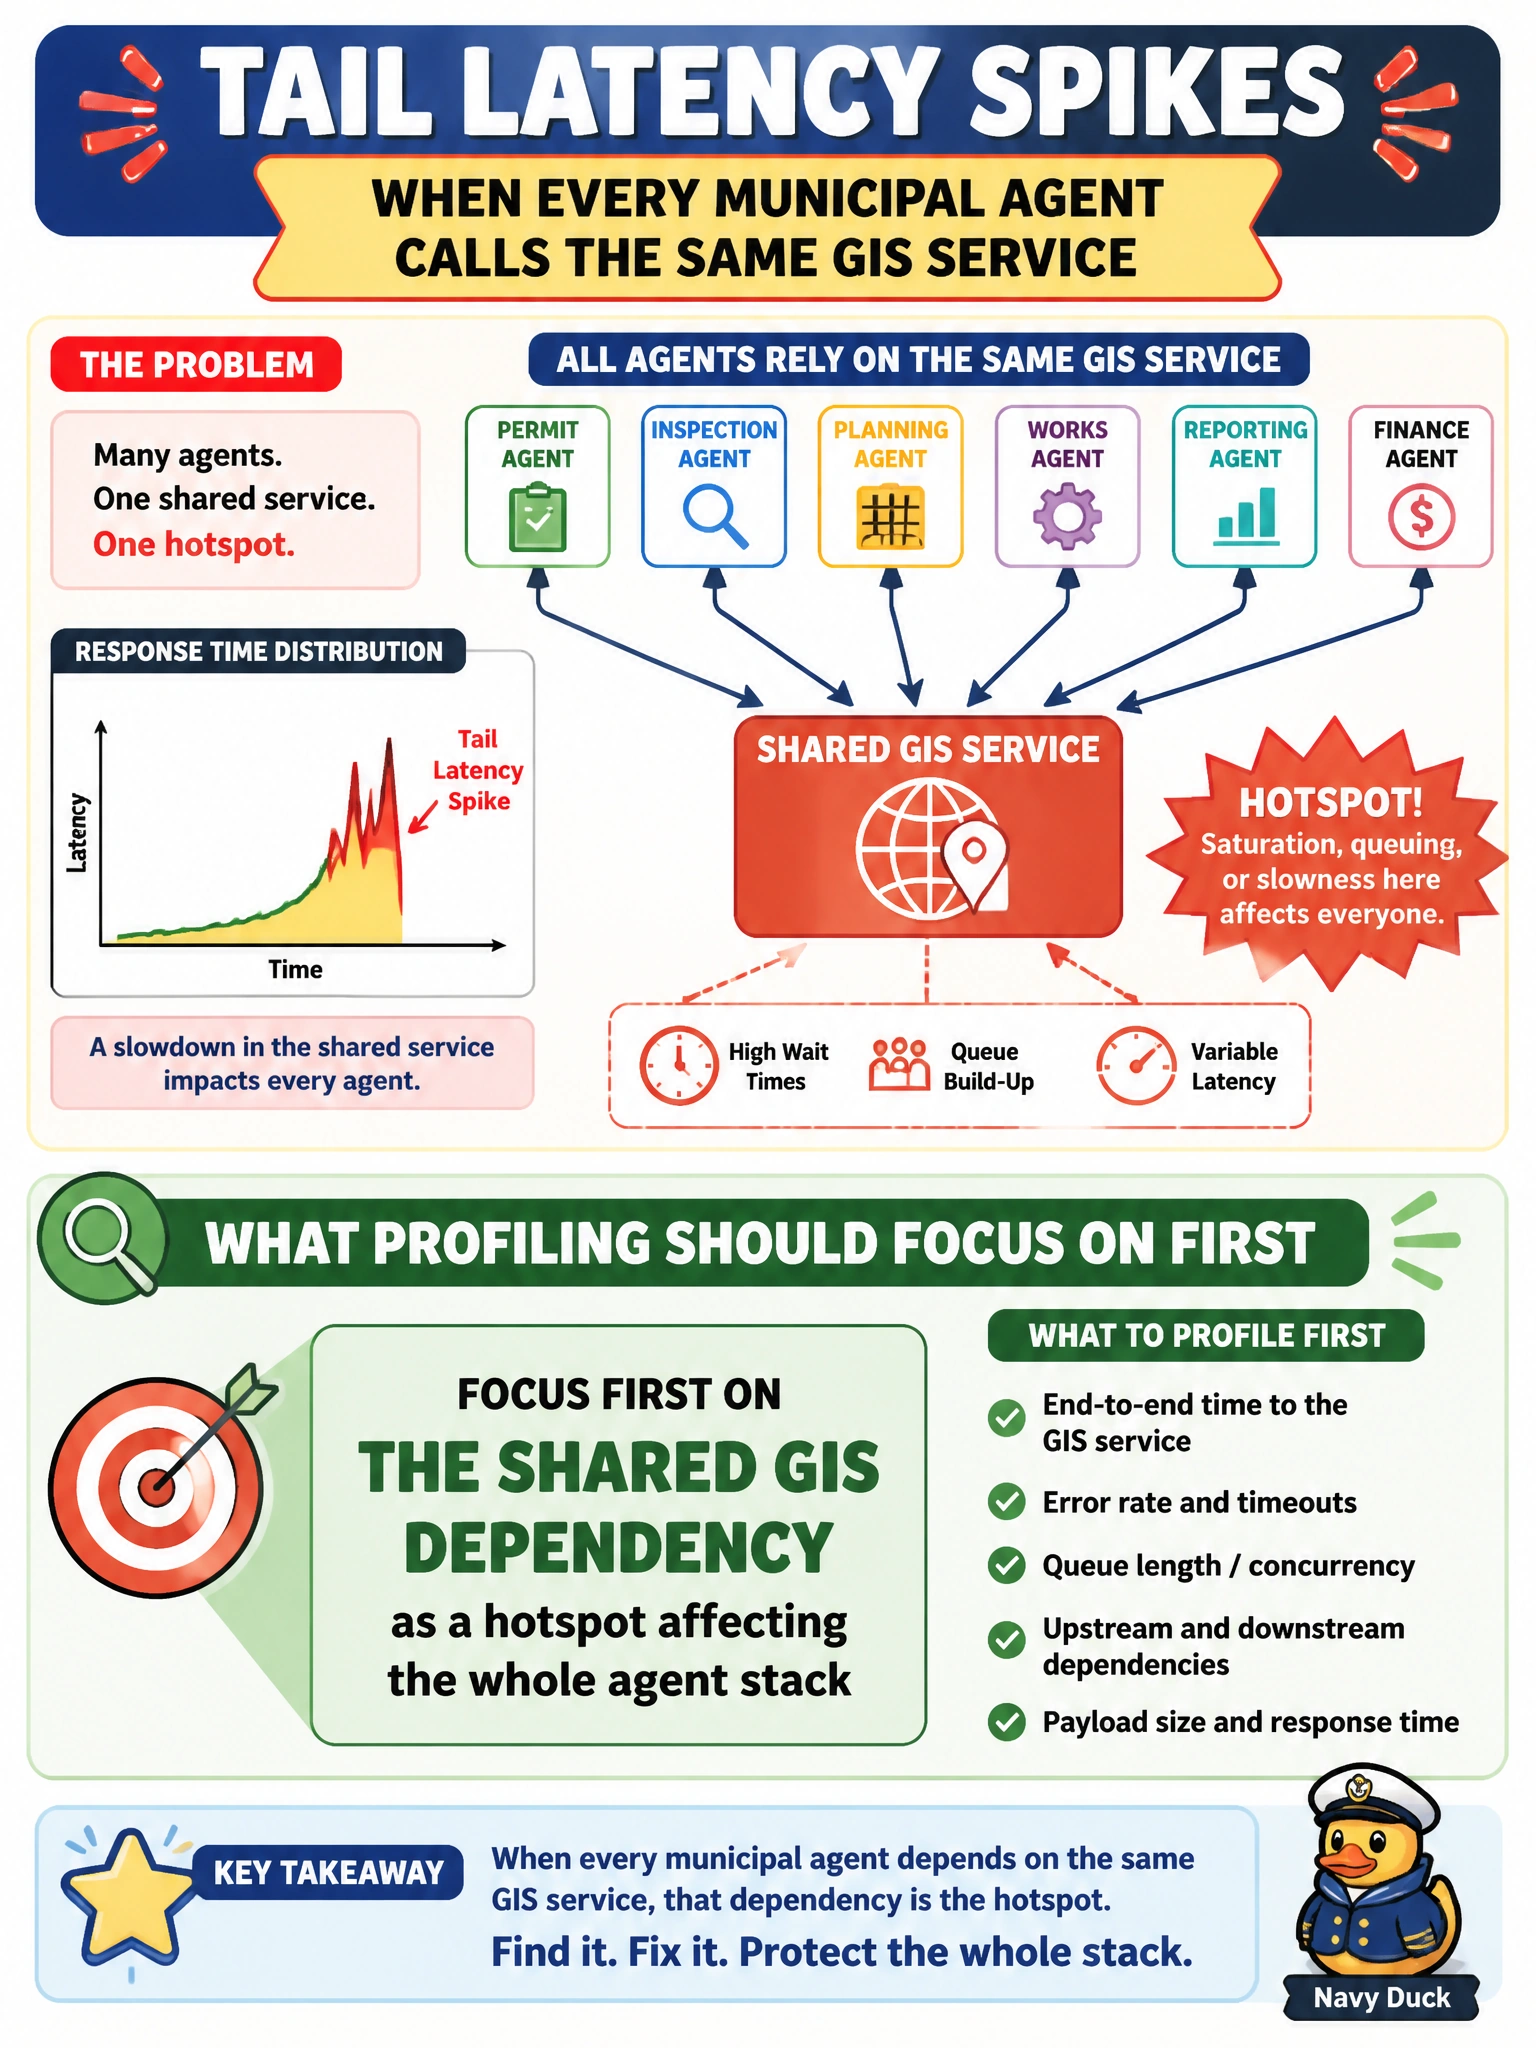
When every municipal agent queues up at the same GIS service, you should treat that shared dependency as the hotspot and profile its effect across the stack. Logo colors and button preferences don’t explain tail latency, and renaming the hostname won’t clear the queue.
Full Explanation
When every municipal agent calls the same GIS service, tail-latency spikes point first to a shared dependency hotspot, not a cosmetic interface issue. Profile the GIS dependency’s contribution to end-to-end latency: request rates across agents, GIS p95/p99, connection pools, cache hit rates, timeouts, and retry amplification. In a city stack spanning zoning, 311, transit, and permitting, agents may independently request geocodes or parcel lookups; without coordinated profiling, you may blame model inference while the GIS queue is the real bottleneck. The GIS logo’s city brand palette has no causal link to latency distributions, and residents’ preference for green buttons on the map widget concerns product design, not backend performance. Renaming the GIS hostname does not remove contention, capacity limits, or chatty client behavior; it could instead disrupt caches or certificates without fixing the hotspot. Exam caveat: after confirming the GIS hotspot, distinguish capacity limits from chatty fan-out—many agents calling GIS per turn—and missing edge caching of stable geometries. Fixing one layer may leave residual spikes, and retries can multiply load during slowdowns. Practical check: instrument per-agent GIS call counts and latency, run a coordinated multi-agent load test, compare GIS metrics with agent-facing p99, then assess caching, batching, circuit breakers, dedicated GIS capacity, or request coalescing before declaring the stack healthy.