
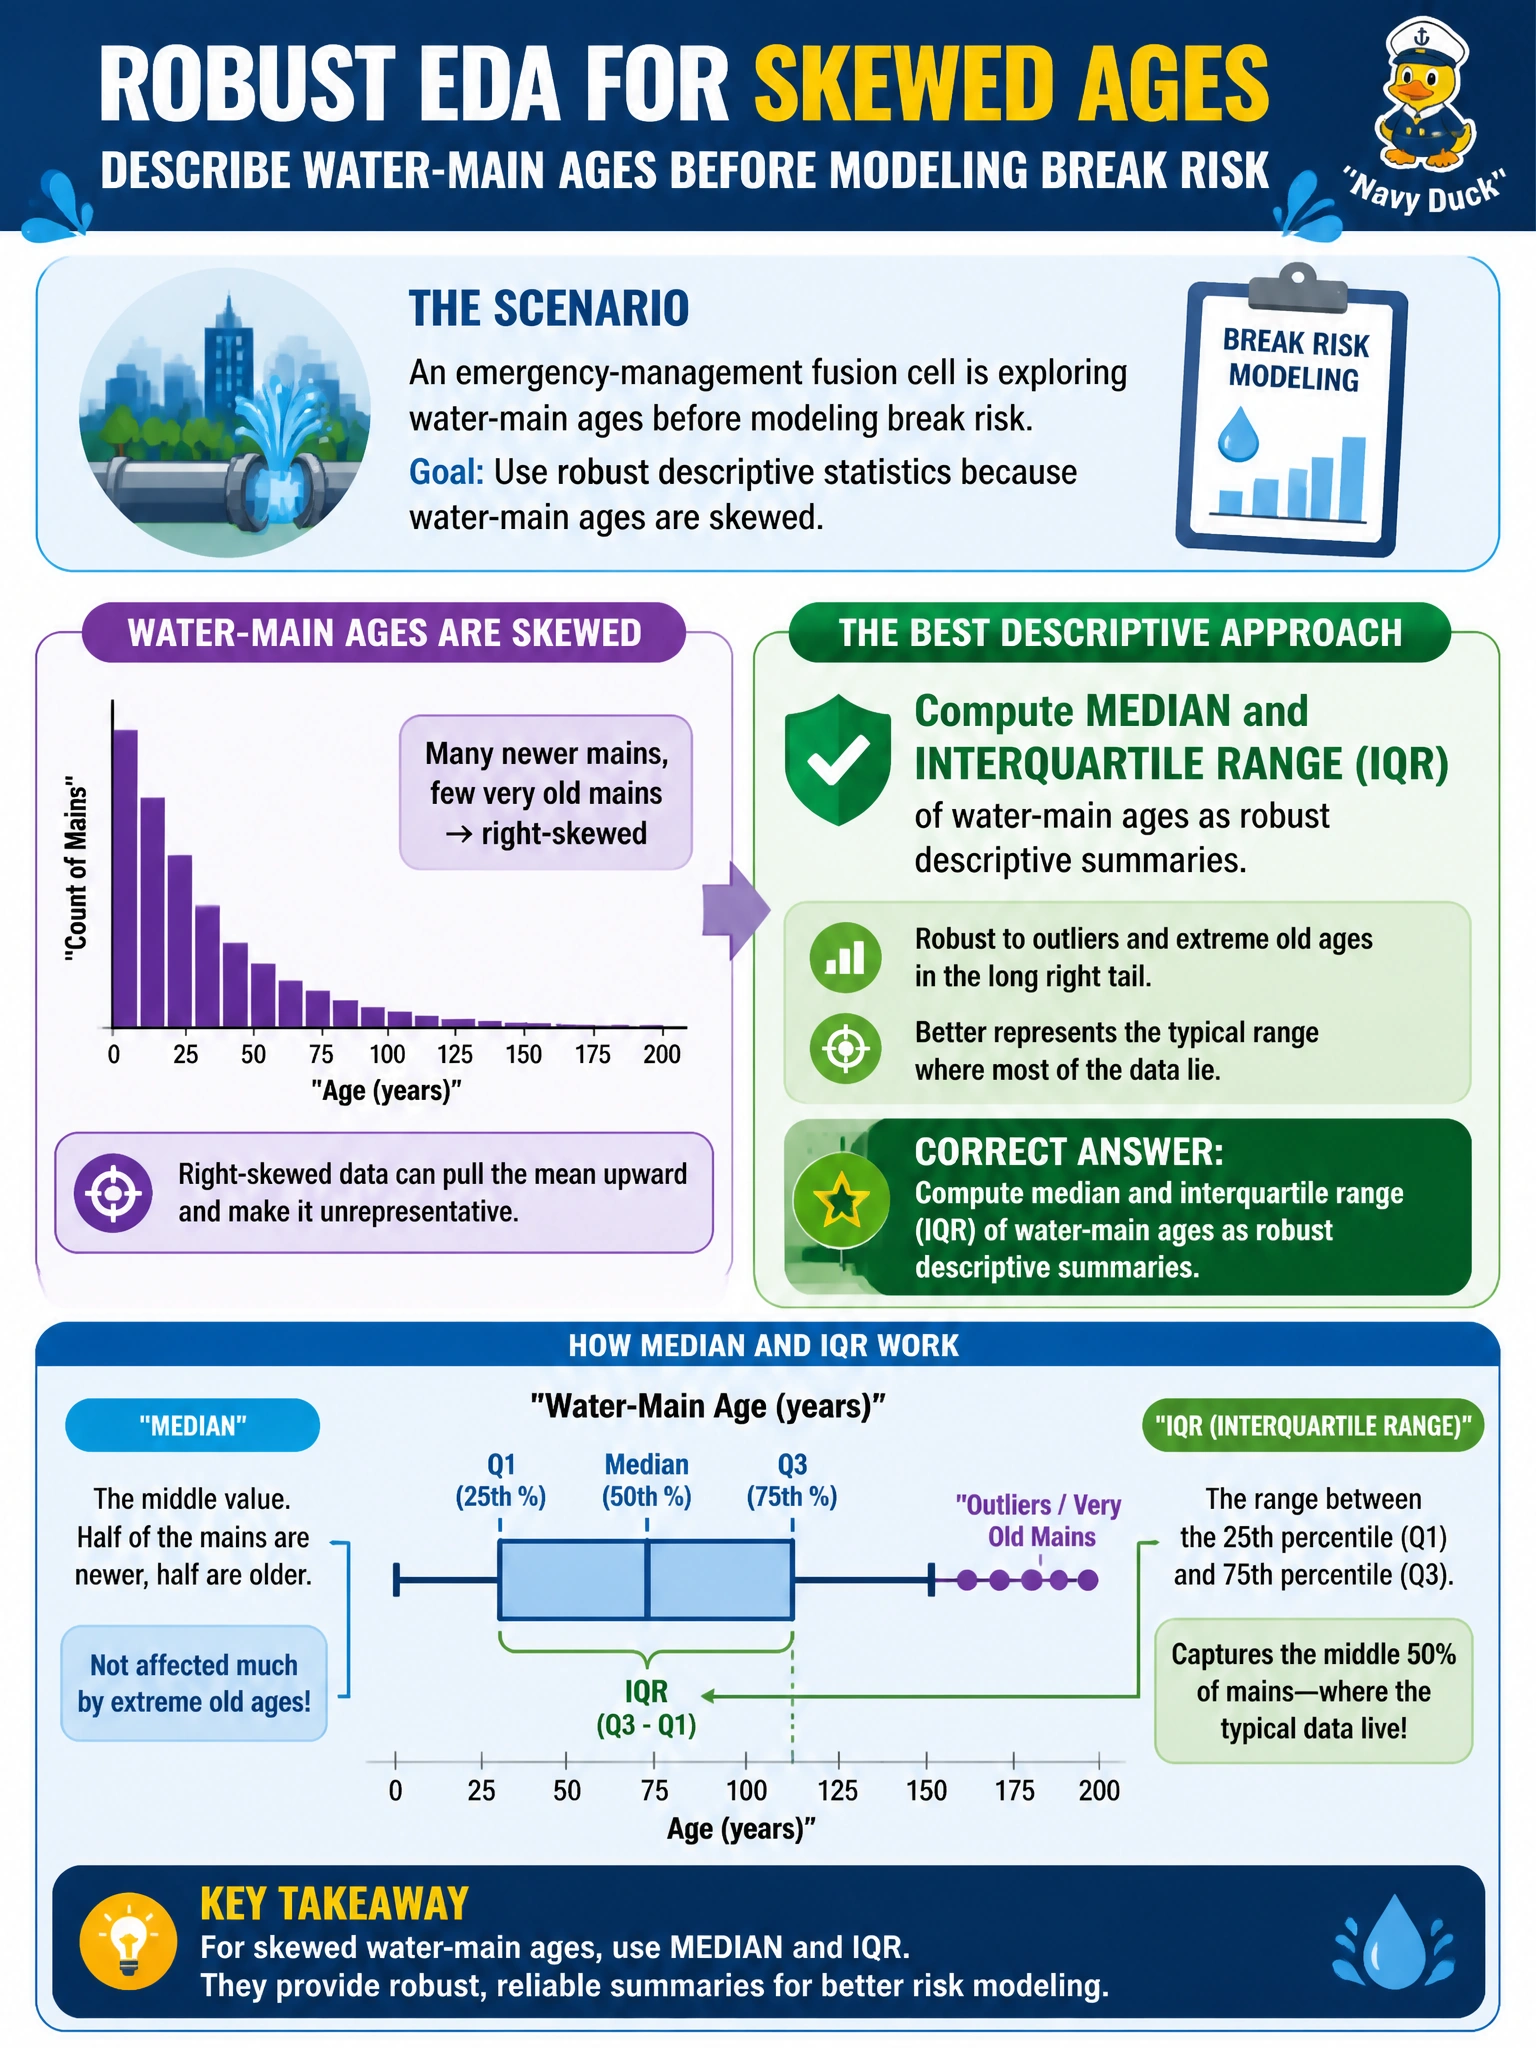
An emergency-management fusion cell is exploring water-main ages before modeling break risk. Which descriptive approach best fits robust EDA under skewed ages?
Select an answer to reveal the explanation.
Short Explanation
Skewed pipe ages love to yank the mean around—median and IQR are the steadier city rulers for first looks. Start EDA with those robust summaries before anyone models break risk. Max-only or mean-only shortcuts hide the spread emergency managers actually need.
Full Explanation
Exploratory descriptive analysis on skewed water-main ages should lead with robust summaries—median and interquartile range (IQR)—rather than extremes or a single mean. Pipe-age inventories in emergency-management break-risk studies are typically right-skewed: a long tail of very old mains pulls the arithmetic mean upward while most mains sit younger. Median locates the typical main; IQR describes the central spread without letting a handful of century-old segments dominate the story. Those robust descriptives give the fusion cell a trustworthy first picture before any break-risk model is fit.
Reporting only the maximum age ignores almost the entire distribution and can panic planning around a single antique segment that is not representative. Dropping every age column before descriptive statistics removes the very feature EDA is meant to characterize and blocks later modeling readiness. Replacing all ages with a single citywide mean and skipping further EDA both destroys variance information and chooses a non-robust location measure under skew, defeating the purpose of descriptive exploration.
Exam caveat: under skew, prefer median/IQR (and related robust stats) over max-only or mean-only shortcuts; do not drop the column to “simplify.” Operational check: compute median and IQR of water-main age by pressure zone, plot a histogram or box plot to confirm skew, document any imputed or unknown ages separately, and only then decide on transforms or model features for break-risk work.