
A developer wants to analyze the runtime execution timeline of a deep learning model across the host CPU and multiple NVIDIA GPUs. Which NVIDIA performance profiling tool provides a system-wide visualization of CUDA API calls, GPU kernel execution, and memory transfer operations?
Select an answer to reveal the explanation.
Short Explanation and Infographic
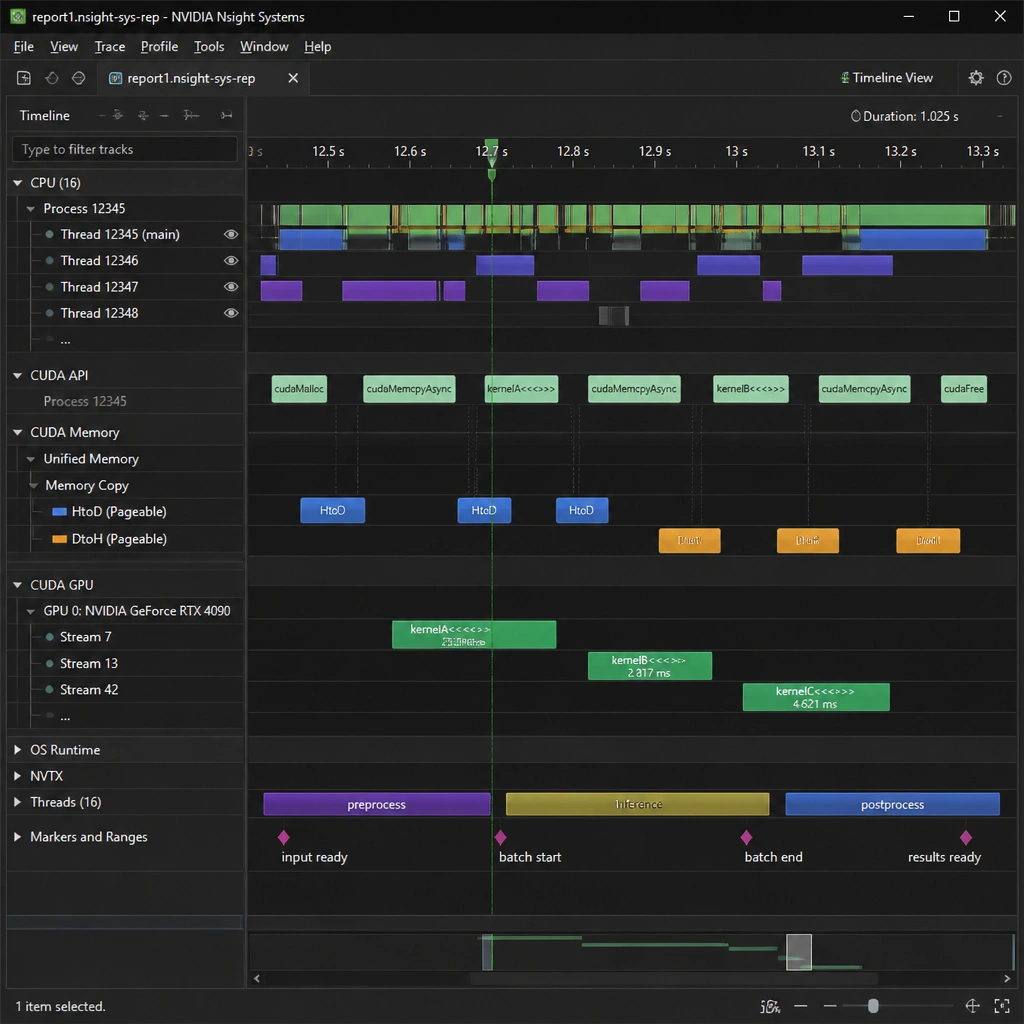
Okay, let's dive into performance optimization. Imagine your model is running slower than expected, and you need to figure out why. Is it waiting for data to copy from host memory to the GPU? Or is a specific CUDA kernel taking too long to execute? You can't just guess—you need data! That is where NVIDIA Nsight Systems shines. Think of it as a super-detailed timeline visualizer for your system. It maps out exactly when CPU threads are active, when CUDA API calls occur, when memory transfers happen over PCIe or NVLink, and when the GPU is actually crunching kernels. This lets you spot those nasty gaps where the GPU is just sitting there doing nothing. NVML is just for fetching basic stats, the CUDA Debugger is for fixing code bugs, and the Driver Manager just manages software updates. For profiling and visual analysis, Nsight Systems is the tool you need.
Full explanation below image
Full Explanation
NVIDIA Nsight Systems is a system-wide performance analysis and profiling tool designed to help developers identify bottlenecks in their applications across both the CPU and GPU. It provides a visual, interactive timeline of application execution, allowing users to analyze performance characteristics without excessive profiling overhead. Key capabilities include: - Unified Timeline: Visualizes CPU thread activity, OS runtime events, CUDA API calls, memory copies (host-to-device and device-to-host), and GPU kernel execution times. - Bottleneck Identification: Helps identify periods of GPU underutilization, CPU-bound bottlenecks, or inefficient data transfer patterns (such as excessive PCIe serialization). - Multi-GPU Support: Profiles applications spanning multiple GPUs and nodes to identify synchronization and communication overheads (e.g., NVLink or InfiniBand delays).
The other options do not provide profiling timeline capabilities: - NVIDIA Management Library (NVML) (Option A) is a C-based API used for monitoring and managing various states of NVIDIA GPU devices (such as temperature, fan speed, power, and utilization). It does not provide detailed application execution or kernel-level profiling. - CUDA Debugger (Option C), such as cuda-gdb, is used for software debugging to find errors, step through code execution, and inspect variables, rather than profiling performance. - NVIDIA Driver Manager (Option D) is a utility used for installing, configuring, and updating NVIDIA display and CUDA drivers, and plays no role in application performance profiling.